How to Create a User Journey Map: Do Not Draw Only an Emotion Curve
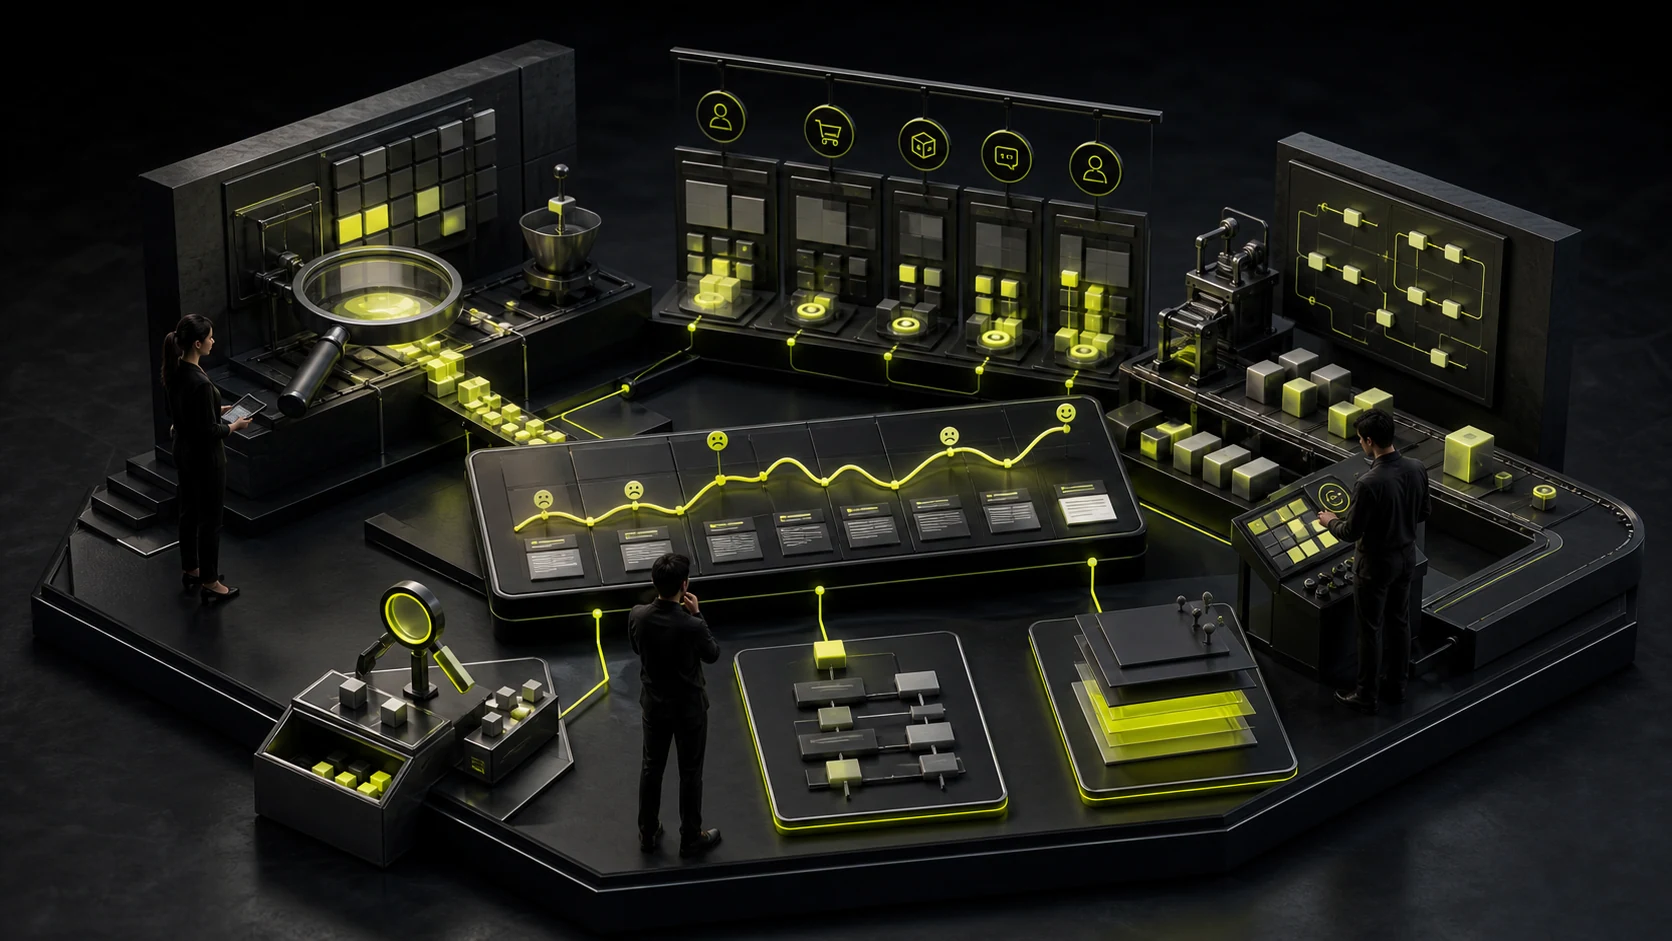
A journey map containing only Awareness—Comparison—Purchase—Use and a curve from frown to smile rarely guides design. It looks complete but does not explain where pain originates, who owns it, which metrics it affects, or whether evidence supports the journey.
A journey map containing only Awareness—Comparison—Purchase—Use and a curve from frown to smile rarely guides design. It looks complete but does not explain where pain originates, who owns it, which metrics it affects, or whether evidence supports the journey.
01 A Journey Map Is First an Alignment Tool, Not a Presentation Poster
It places users' events, channels, judgments, and emotions over time on one timeline so Product, Marketing, Sales, Support, and Operations see the same service. The value is not drawing it but finding departmental handoffs, information breaks, and accountability gaps.
Journey maps suit multistep, cross-channel, cross-team experiences. For example, an enterprise customer searches for a design firm, browses cases, submits requirements, compares quotes, contracts, gives feedback, accepts delivery, and receives maintenance. For button-level steps on one page, a user flow may be more direct.
02 Define the Scope First: Who, Where It Starts, and Where It Ends
"The complete journey for every user" is usually too broad. Before starting, define:
- Primary Role: Whose journey—for example, an enterprise marketing leader, not simply "customer."
- Objective: What must they complete—for example, shortlist and contract a corporate website provider.
- Starting Point: When the need truly appears, not the website Home page.
- End Point: Contract, launch, repurchase, or long-term use?
- Context Boundary: Does it include online, offline, and internal approval?
- Current or Future State: What happens now, or what the team hopes will happen?
Do not place current and future states in one layer, or problems and solutions become mixed.
03 Evidence Comes Before Emotion Colors
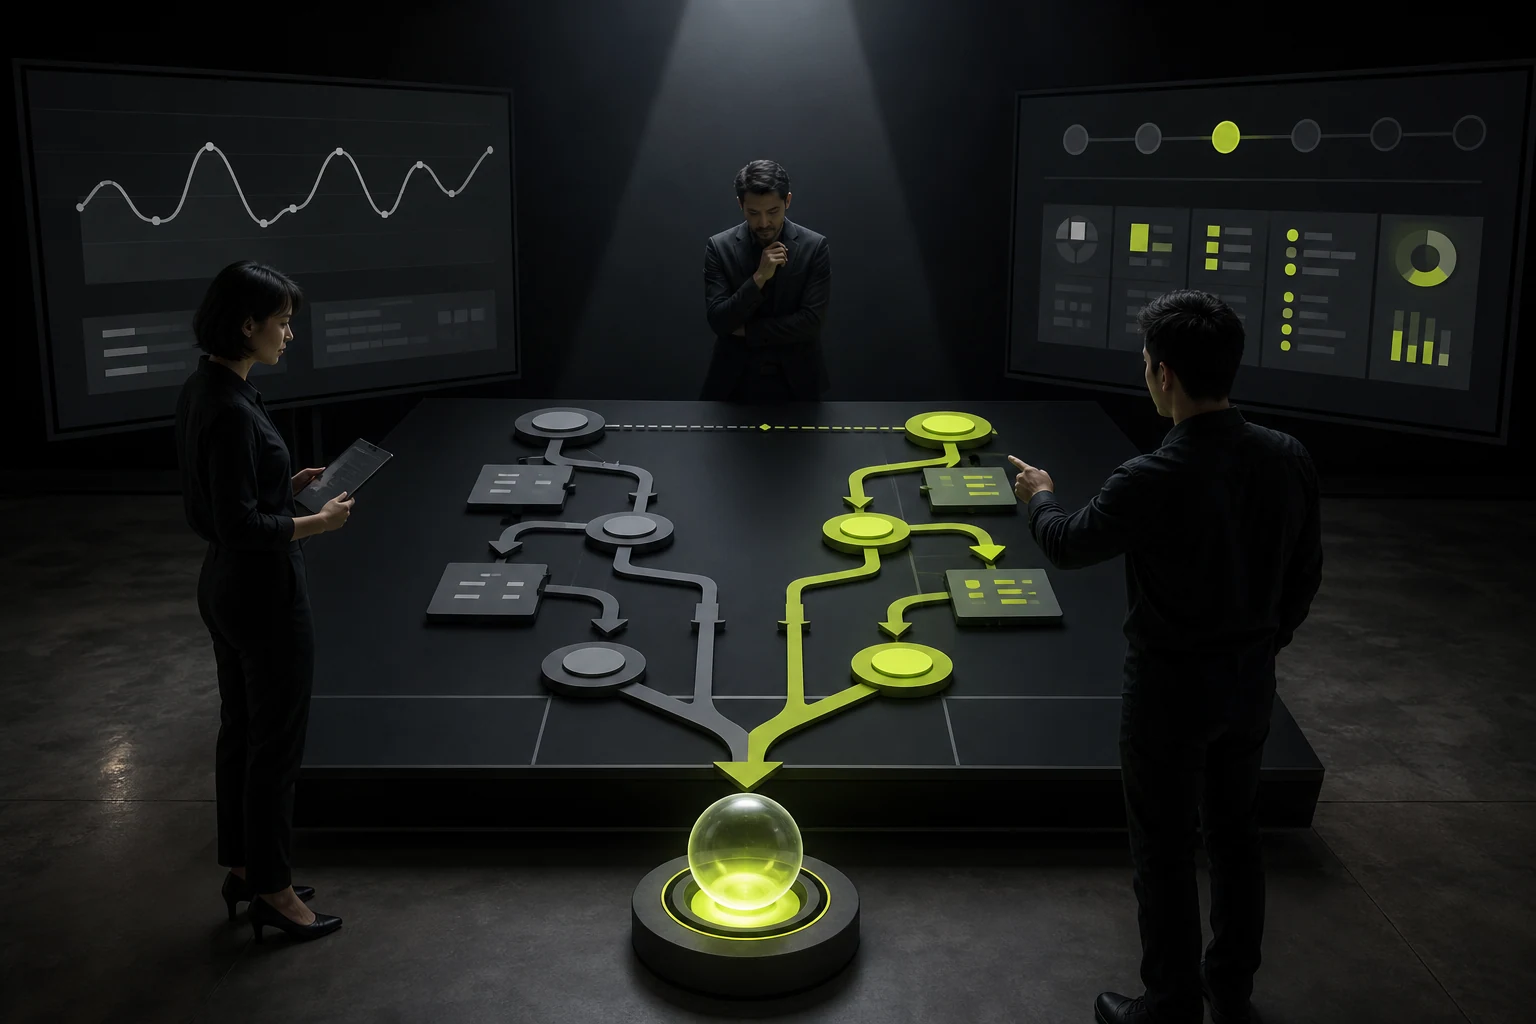
Journey maps may draw on interviews, observation, support records, search terms, forms, sales CRM, product logs, and tickets. Every critical pain point should trace to at least one form of evidence.
If a stage comes only from internal assumptions, mark it as a hypothesis and list validation questions. Honest blanks are more useful than filling the map with an attractive red curve.
04 An Actionable Journey Map Has at Least Ten Layers
| Layer | Question to Answer |
|---|---|
| Stage | Which natural events divide the journey? |
| Trigger | What moves users into the next stage? |
| Goal | What do they truly need to complete now? |
| Behavior | Which actions do they actually take? |
| Touchpoint | Corporate website, search, email, phone, product, or offline? |
| Questions and Information Needs | What are they judging, and what is missing? |
| Emotion and Risk | Why are they anxious, hesitant, or confident? |
| Evidence | Which interview, data point, or ticket supports this? |
| Backstage and Owner | Which team, system, and process affect this moment? |
| Metric and Opportunity | How will improvement be measured, and what comes first? |
Not every map must display every layer, but the analytical working file should retain them.
05 Example: An Enterprise Selecting a Corporate Website Design Provider
| Stage | User Task | Primary Touchpoint | Common Pain Point | Backstage Cause | Verifiable Metric |
|---|---|---|---|---|---|
| Need Emerges | Align redesign goals and budget | Internal meetings and legacy website data | Departments have conflicting goals | No project owner or scope brief | Requirement-alignment time and rework count |
| Search and Shortlist | Find credible candidates | Google, case pages, and referrals | Cases look attractive but do not explain service scope | Cases omit context, process, and results | Journey from case page to inquiry |
| Inquiry and Communication | Determine whether the team understands the business | Form, WeChat, and meeting | Requirements are repeated and feedback language differs | No unified Brief or record | First-response time and complete valid requirements |
| Compare Proposals | Compare scope, method, and risk | Proposal, quote, and contract | Total prices are comparable; delivery scopes are not | Quote formats and acceptance criteria differ | Decision cycle and clarification-question count |
| Execution and Feedback | Confirm direction by phase | Figma, meetings, and documents | Fragmented feedback from many people reverses decisions | No feedback owner or version policy | Time per revision round and out-of-scope requests |
| Acceptance and Launch | Confirm functions, content, and assets | Test site, checklist, and source files | Pages launch while materials remain incomplete | Acceptance reviews visuals only, with no asset checklist | Defect count and delivery completeness |
This table naturally shows that many "website experience problems" originate in internal workflows and service delivery, not web components.

06 Define Stages by User Events, Not Company Departments
Marketing, Sales, and Delivery are an organizational view; Need, Compare, Decide, Implement, and Verify better represent the user's experience. Put departments in the backstage ownership layer instead of using them to divide the journey.
Five to eight stages are generally readable. Too few hide critical transitions; too many turn the map into a process checklist.
07 Look for Breaks and Handoffs Before Emotional Low Points
The most valuable issues in a journey are often:
- Users provide the same information repeatedly.
- State is lost when work moves between systems.
- Users receive no confirmation after an action.
- Frontstage promises differ from backstage execution standards.
- Several departments participate, but no one owns the final outcome.
- Risk is high, but help and recovery paths are unclear.
These problems usually require cross-team changes, not a copy edit.
08 Prioritize Opportunities Instead of Building an "Inspiration Wall"
Score every opportunity on user impact, business impact, evidence strength, and implementation cost. High-impact, well-evidenced, moderate-cost problems enter solutions first; high-risk but weakly evidenced problems need research; low-impact visual refinements should not lead simply because they are easy.
| Opportunity | User Impact | Business Impact | Evidence | Cost | Recommendation |
|---|---|---|---|---|---|
| Provide a Standard Requirement Checklist Before Inquiry | High | High | High | Low | Implement First |
| Add Complex AI Recommendations | Unknown | Medium | Low | High | Validate the Need First |
| Adjust Case-Card Animation | Low | Low | Medium | Low | Defer |
| Unify Project State and Notifications | High | High | High | Medium | Plan Across Teams |
09 Do Not Confuse Journey Maps, Flowcharts, and Service Blueprints
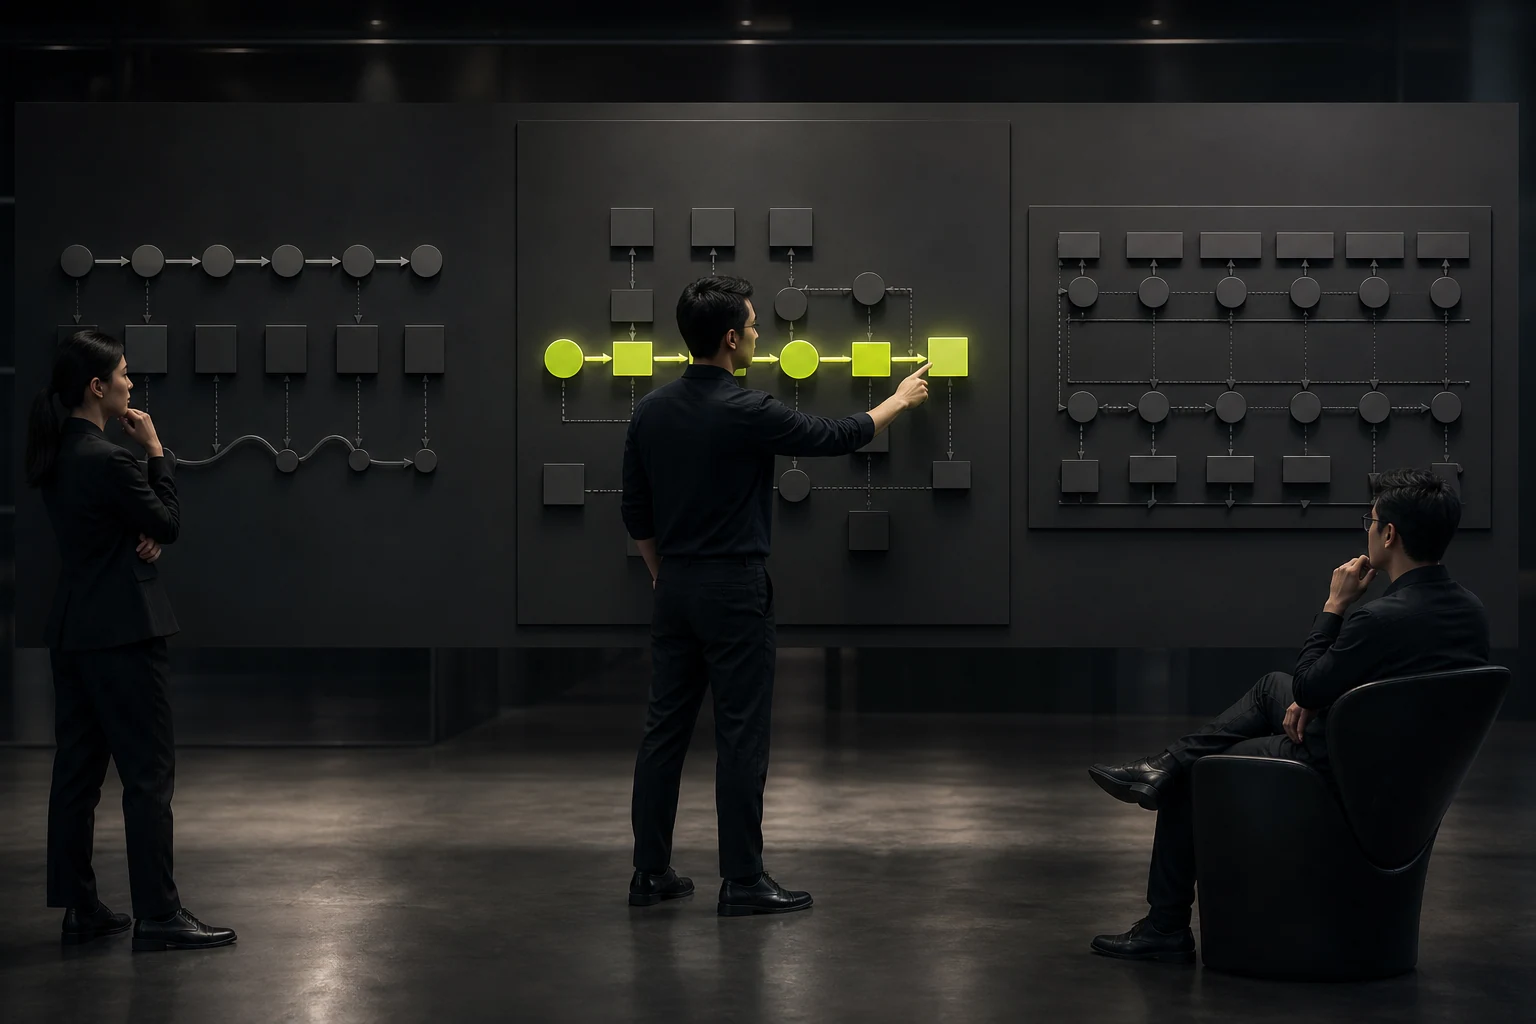
- User Flow: Focuses on user steps and branches inside a product or task.
- User Journey Map: Focuses on cross-touchpoint experiences, problems, and feelings over time.
- Service Blueprint: Adds frontstage staff, backstage processes, systems, policies, and support resources to a journey.
- Experience Map: May cover a broader scope and does not necessarily center on one brand or service.
When problems clearly originate in backstage ownership and system handoffs, continue from the journey map to a service blueprint.
10 How to Run a Two-Hour Journey Workshop
- 15 minutes: Confirm role, objective, start, and end.
- 25 minutes: Arrange real events using research materials.
- 20 minutes: Add touchpoints, information needs, and behaviors.
- 20 minutes: Mark pain points, emotions, and evidence.
- 20 minutes: Add backstage owners and systems.
- 15 minutes: Propose and score opportunities.
- 5 minutes: Assign owners, next steps, and validation questions.
Do not ask everyone to generate sticky notes from memory. Prepare interview excerpts, analytics, tickets, and current processes so the workshop does not become an opinion poll.
Frequently Asked Questions
Can We Draw a Journey Map Before User Research?
You can create a hypothetical journey to expose differences in team assumptions, but label hypotheses explicitly and schedule validation. Do not present an internal workshop artifact as user fact.
Does Every Persona Need a Separate Journey Map?
Split maps only when roles have clearly different objectives, permissions, or paths. Copying maps by superficial characteristics such as age or gender increases maintenance without adding value.
Is an Emotion Curve Required?
No. Without reliable emotion evidence, use confidence, friction, or risk, or describe problems directly. Do not force scores for visual completeness.
Who Maintains the Journey Map After Completion?
The owner closest to the business and user research should maintain it and update it after process, policy, or product changes. It is cross-team decision material, not a one-time presentation.
11 Bring the Journey Map into the Next Decision
The best journey map is reopened when setting a roadmap, redesign scope, service process, or metrics—not hung on a wall. Every opportunity needs evidence, an owner, and a next step, or even a beautiful map becomes only a project souvenir.
| Service | View |
|---|---|
| UI/UX Design Services | View Service Details |
| Project Inquiry | Contact JVDS Design Studio |
| Design and Website Development Articles | Read More Articles |
 Link copied