How to Measure UI/UX Design ROI: From Efficiency and Conversion to Support Costs
After a design project ends, teams often summarize its value as “a more modern interface” or “positive customer feedback,” while executives ask whether the investment was worthwhile. Neither view is complete, because improvements to the experience must connect to user behavior and business outcomes.
Measuring UI/UX ROI does not mean attributing every change to design. It means establishing a baseline, defining the changes, controlling other variables, and observing a set of metrics tied to the goal.
01 Define the Business Problem the Design Must Solve
For checkout optimization, track completion and failure rates. For a redesigned B2B approval flow, track processing time and errors. For a restructured help center, track self-service resolution and support volume.
Without a specific problem, ROI remains limited to abstract brand value.

02 Establish a Pre-Redesign Baseline
Record key data, user feedback, process time, and support costs before the change, segmented by channel, device, and role. Without a baseline, any later increase or decline is difficult to interpret.
Keep measurement definitions stable so analytics changes do not create false improvements.
03 Organize Metrics into Behavioral, Operational, and Financial Layers
Behavioral metrics include completion, errors, time, and satisfaction. Operational metrics include support, training, manual processing, and rework. Financial metrics include revenue, cost, retention, and customer value.
Not every project can calculate revenue directly. Demonstrating intermediate outcomes is still meaningful.
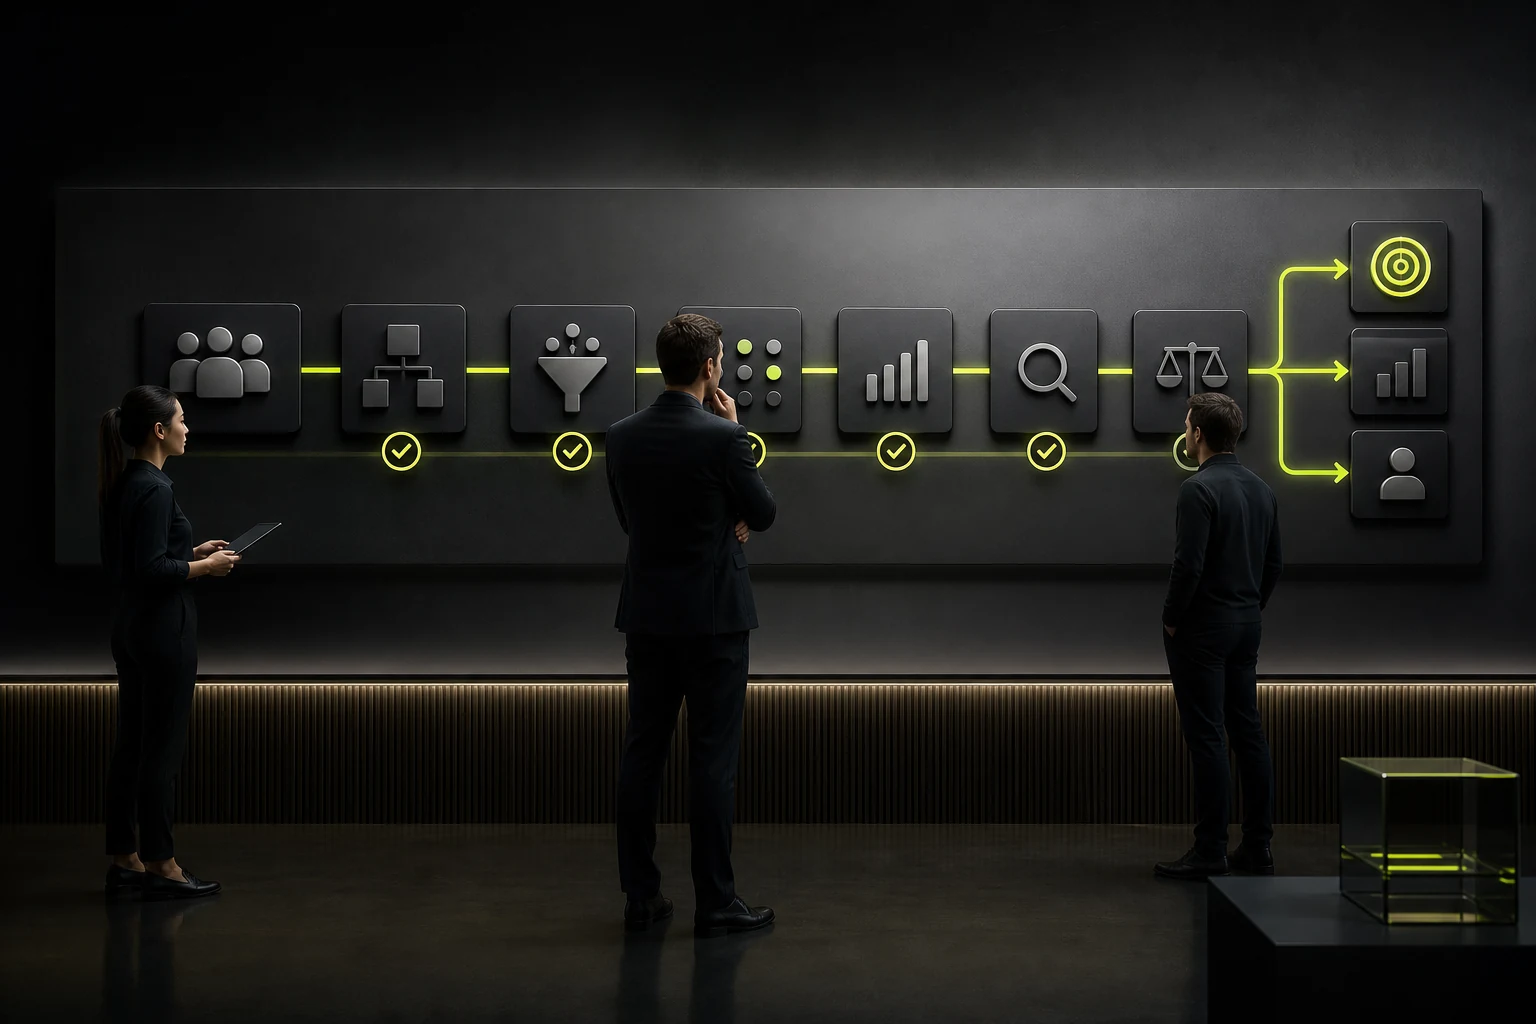
04 Avoid Over-Attribution When Calculating Returns
Marketing, pricing, channels, product capabilities, and seasonality all affect results. A/B testing, phased releases, control groups, or time-series analysis can improve the credibility of conclusions.
When rigorous experimentation is impossible, state clearly that the relationship is an association rather than complete causation.
05 Include Design Systems and Development Efficiency
Unified components can reduce repetitive design, frontend implementation effort, and quality issues. Track page delivery time, component reuse, design deviations, and regression defects.
These benefits are often more durable than the conversion impact of a single button.

06 Use Real, Verifiable Data in the ROI Formula
A basic formula is (return − investment) ÷ investment. Returns include additional gross profit and quantifiable savings. Investment includes research, design, development, testing, and maintenance.
When data is insufficient, use ranges and scenario analysis rather than inventing precise numbers to prove design value.
UI/UX Value Metrics
Business Problem | Direct Metrics | Extended Value |
|---|---|---|
Process Drop-Off | Completion rate, exit step | Revenue and acquisition efficiency |
Complex Tasks | Completion time, error rate | Manual work and training costs |
Insufficient Trust | Inquiry quality, payment abandonment | Sales and repeat purchases |
Support Pressure | Self-service resolution, ticket volume | Customer support costs |
Design Inconsistency | Component reuse, delivery cycle | Engineering efficiency and quality |
Frequently Asked Questions
Can every design project calculate ROI?
Not always with precision. However, teams can establish behavioral and operational metrics and gradually connect them to financial outcomes.
Does a higher conversion rate prove the design caused it?
Not necessarily. Consider changes in traffic, pricing, campaigns, and the product, ideally using experiments or phased validation.
How do you measure the UI of a brand-focused corporate website?
Track understanding of target content, case study engagement, qualified inquiries, sales-team use, and brand perception.
How can the value of B2B design be quantified?
Focus on task time, errors, training, manual processing, support tickets, and development and maintenance costs.
How often should ROI be evaluated?
Check data quality and early behavior after launch, then conduct monthly or quarterly reviews based on the business cycle.
Service | View |
|---|---|
Related Services | |
Related Reading | View Service Details |
Design Case Studies | |
Project Consultation |
 Link copied