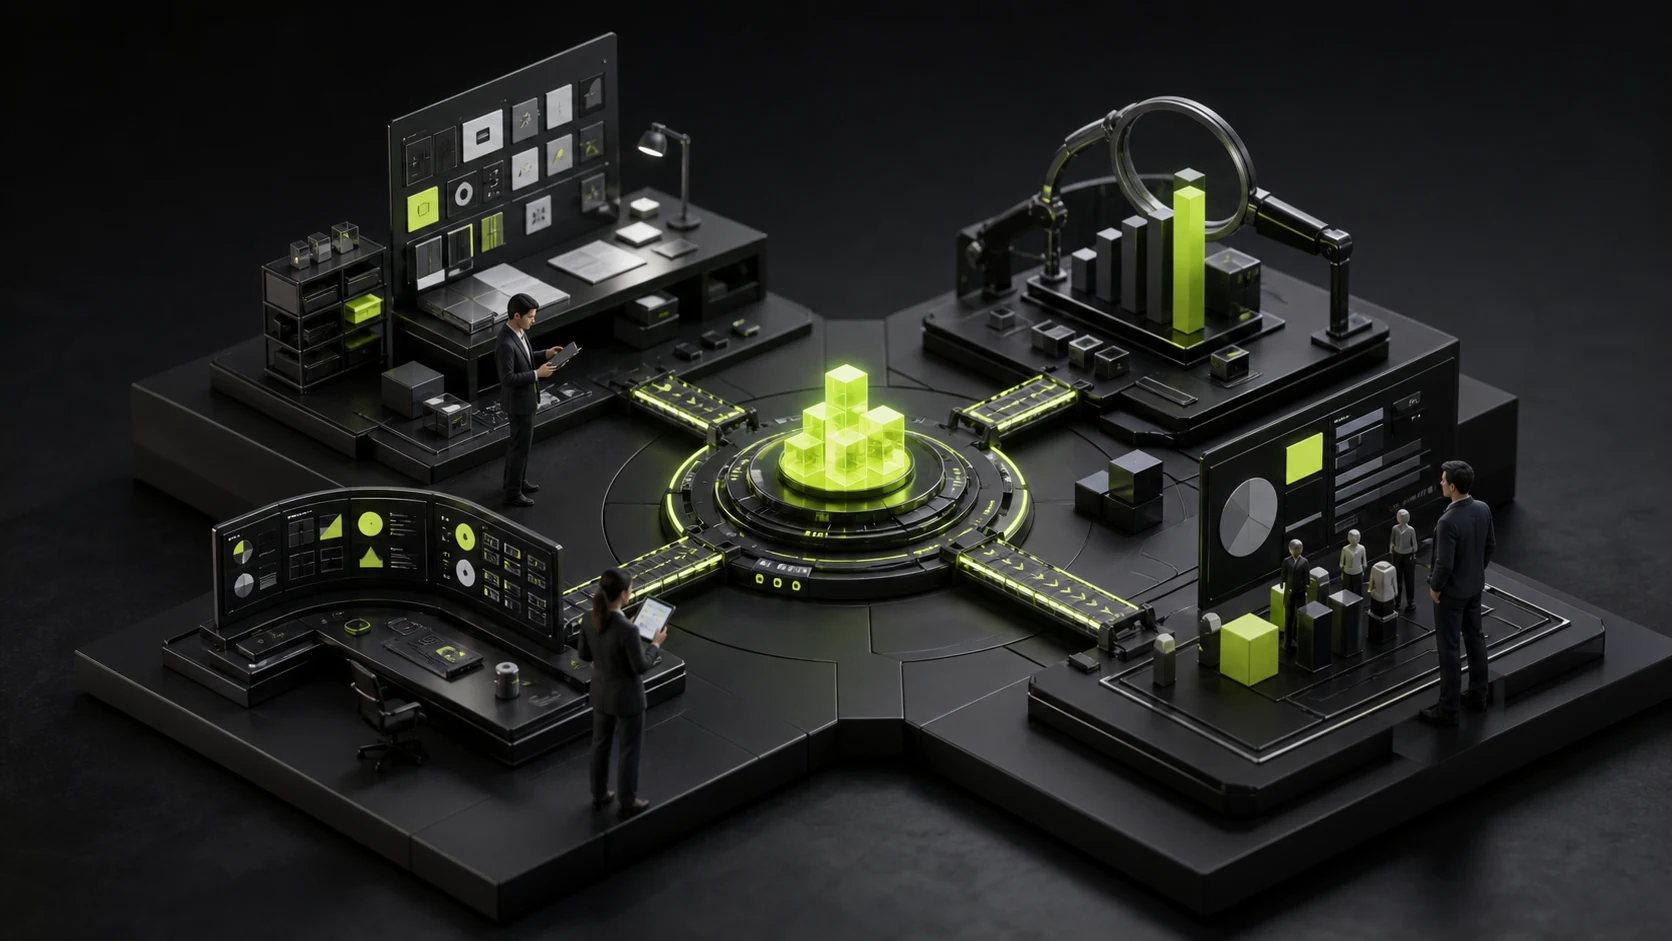
Applause at the brand launch, compliments on social media, and the CEO’s satisfaction with the new logo cannot individually prove that a rebrand worked. Brand-design results appear in multiple places: whether teams create materials faster, users recognize the brand, sales explains value more easily, and the website gains branded searches and qualified inquiries. Measurement must begin with a baseline before design starts.
Applause at the brand launch, compliments on social media, and the CEO’s satisfaction with the new logo cannot individually prove that a rebrand worked. Brand-design results appear in multiple places: whether teams create materials faster, users recognize the brand, sales explains value more easily, and the website gains branded searches and qualified inquiries. Measurement must begin with a baseline before design starts.
01 Distinguish “Design Delivered” from “Brand Producing Results”
| Layer | Question | Example Metrics | Observation Period |
|---|---|---|---|
| Assets and execution | Can the brand system be used correctly? | Template adoption, error rate, production time, and asset coverage | 1–3 months after launch |
| Perception and trust | Does the target audience understand and remember the brand? | Recognition, recall, association, trust, and preference | 3–12 months |
| Behavior | Do users take more valuable actions? | Branded search, direct visits, clicks, inquiries, and content engagement | 1–12 months |
| Business results | Does the brand support revenue, efficiency, and competitiveness? | Qualified opportunities, sales cycle, price acceptance, retention, and recruitment | 6–24 months |
These layers change at different speeds. Teams may adopt guidelines within weeks, while market perception and business results take longer and are also affected by products, campaigns, sales, and market conditions. Do not declare branding ineffective because revenue did not rise immediately, or credit a promotional spike entirely to the new visual identity.
02 Establish a Baseline Before Design or You Will Rely on Memory
At project kickoff, choose metrics tied to the objective and record the current state. Do not collect dozens of numbers. Preserve the evidence the business will actually use in future decisions.
| Project Goal | Pre-Design Baseline | Post-Design Observation | Source |
|---|---|---|---|
| Unify a multi-product brand | Number of logo versions, misuse, and production time | Guideline coverage, template use, and reduced rework | Asset library, design tickets, and internal audits |
| Increase professional trust | Common sales objections, qualified web inquiries, and trust scores | Changed objections, key-page conversion, and interview feedback | CRM, forms, sales records, and research |
| Enter overseas markets | English brand awareness, regional traffic, and content usability | Branded search, overseas inquiries, and channel feedback | Search data, analytics, and channel interviews |
| Replace a dated image | Brand recognition, outdated associations, and direct visits | Old/new recognition, changed associations, and return visits | Perception tests and search and traffic data |

03 Layer One: Do Brand Assets Improve Team Efficiency?
The first value of many brand projects is reduced internal confusion rather than immediate sales. If the new system is only a long PDF while teams still cannot find files, use templates, or work without asking a designer every time, the brand has not entered the organization.
- Asset coverage: how much of the website, product, sales materials, recruiting, social media, and physical collateral has been replaced?
- Misuse rate: how often do old logos, wrong colors, unlicensed fonts, or inconsistent imagery appear?
- Production efficiency: has average time for similar proposals, posters, or pages declined?
- Reuse: can non-design teams correctly use templates, components, and graphic rules?
- Findability: can employees locate the correct version and usage guidance within minutes?
04 Layer Two: Do Users Form the Intended Perception?
Brand perception is more than remembering a logo. Determine whether users recognize the brand, understand what it provides, form relevant associations, and align those associations with positioning. Compare unaided recognition, aided recognition, short-term recall, semantic associations, and trust ratings before and after.
Do not test only employees. They already know the “right” brand answer and cannot represent the market. B2B companies may study prospects, current customers, partners, and job candidates separately because each audience encounters the brand through different tasks.
05 Layer Three: Observe Real Behavior, Not Only Satisfaction Surveys
| Behavior Signal | Possible Meaning | Confound to Exclude |
|---|---|---|
| Growth in branded searches | More awareness or market activity | Advertising, news, and events |
| More direct visits | Users seek the brand more actively | Bookmarks, internal traffic, and analytics changes |
| Higher clicks on key website pages | Clearer information and trust expression | Traffic-source and page changes occurring together |
| Greater use of sales materials | The new system fits real communication better | Sales training and incentives |
| Better inquiry quality | The brand attracts better-matched customers | Campaign targeting and service changes |
| Changed recruiting applications | A clearer employer brand | Openings, compensation, and labor-market conditions |

06 Layer Four: Judge Business Contribution Without Promising Single-Cause Results
Brand design may support price acceptance, reduce explanation time, and improve opportunity quality, but products, sales, service, and media also influence those outcomes. A credible statement explains the observable contribution the rebrand made to a result rather than claiming that “the new logo increased revenue by 30%.”
Brand metrics should not give design credit for every gain. They should show where design contributes and where product and operations still need to solve problems.
07 Three More Reliable Comparison Methods
- Before-and-after baseline: preserve definitions, compare similar periods, and record concurrent campaign, product, and market changes.
- Channel comparison: launch the new system first in one region, channel, or material set and compare it with an unchanged group.
- Task comparison: ask target users to complete the same task with old and new websites, proposals, or packaging, then compare comprehension, trust, and choice.
When a controlled experiment is impossible, combine website behavior, brand research, sales interviews, support issues, and internal efficiency. A conclusion supported by multiple sources is stronger than one satisfaction score.
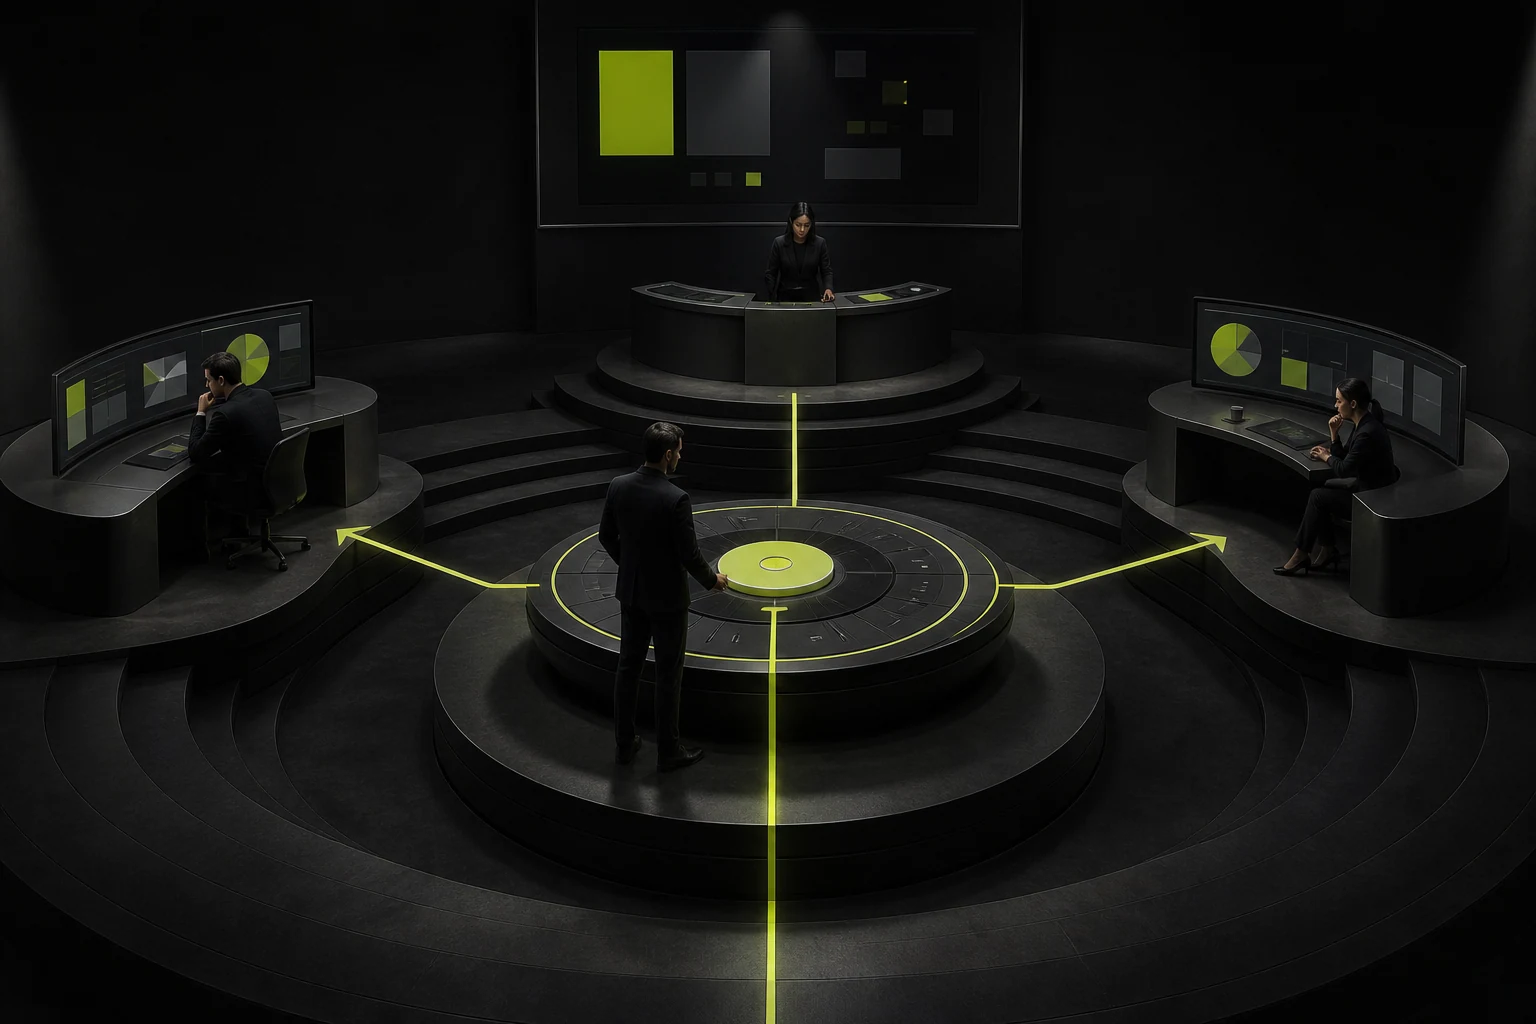
08 A 90/180/365-Day Review Cadence
| Time | Main Work | Key Metrics | Possible Action |
|---|---|---|---|
| Before launch | Record baseline, asset inventory, and objectives | Old assets, perception, traffic, and sales issues | Define measurement and ownership |
| 90 days | Review implementation and internal adoption | Replacement rate, template use, errors, and feedback | Add training, templates, and missing scenarios |
| 180 days | Review user perception and behavior | Recognition, trust, branded search, and key paths | Adjust copy, content, and touchpoints |
| 365 days | Evaluate business contribution and governance | Opportunity quality, cycle, efficiency, and long-term perception | Optimize brand architecture and next-year investment |
09 A Brand-Effectiveness Dashboard Can Be Simple
Each month, one page can record internal asset coverage and errors, branded search and direct visits, key website conversions, recurring sales feedback, audience research, and major market activities. Include definitions and interpretations beside metrics instead of showing only arrows.
10 Five Reports Most Likely to Mislead Management
- Showing social likes without explaining whether they came from paid media or giveaways.
- Attributing all website conversion lift to visuals while ignoring traffic and form changes.
- Measuring only how many people prefer the new design without testing recognition and value comprehension.
- Using employee surveys to represent external market perception.
- Never checking whether stores, sales, product teams, and partners use the brand correctly after launch.
Frequently Asked Questions
Can brand-design ROI be calculated directly?
Businesses can estimate brand-related investment and contribution, but usually cannot attribute revenue entirely to design. Report financial, behavioral, perception, and internal-efficiency evidence together, including assumptions and confounds.
What if we lack the budget for large brand research?
Start with small target-user interviews, five-second recall tests, sales records, branded search, and asset audits. Use the same method before and after instead of collecting compliments only after the redesign.
Does higher logo recognition mean the brand succeeded?
No. Users must also understand the offering, trust it, and act. Recognition is only one part of brand effectiveness.
How long until a rebrand shows results?
Internal implementation can appear within weeks or months; market perception and business results usually take longer. Review the layers at 90, 180, and 365 days.
| Service | View |
|---|---|
| Brand identity design | View service details |
| Project inquiry | Contact JVDS Design Studio |
| Design and web articles | Read more articles |
 Link copied