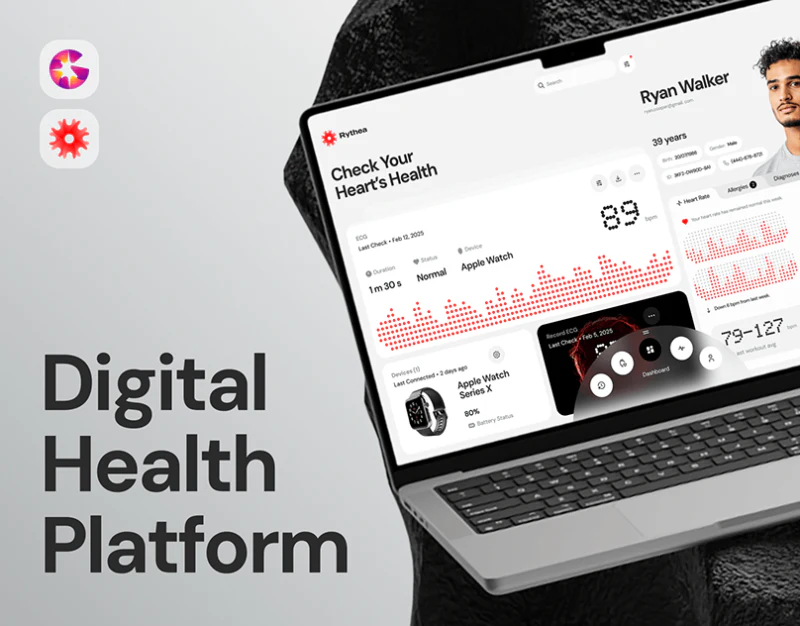
Rythea combines dot-matrix numbers, red graphics, and white cards into a distinctive health interface. Numbers are prominent, while record times and sources have their own positions. Cardiac monitoring interface design should make these labels work with graphics to distinguish individual records, collection states, and period summaries.
Main records and weekly summaries use different scales
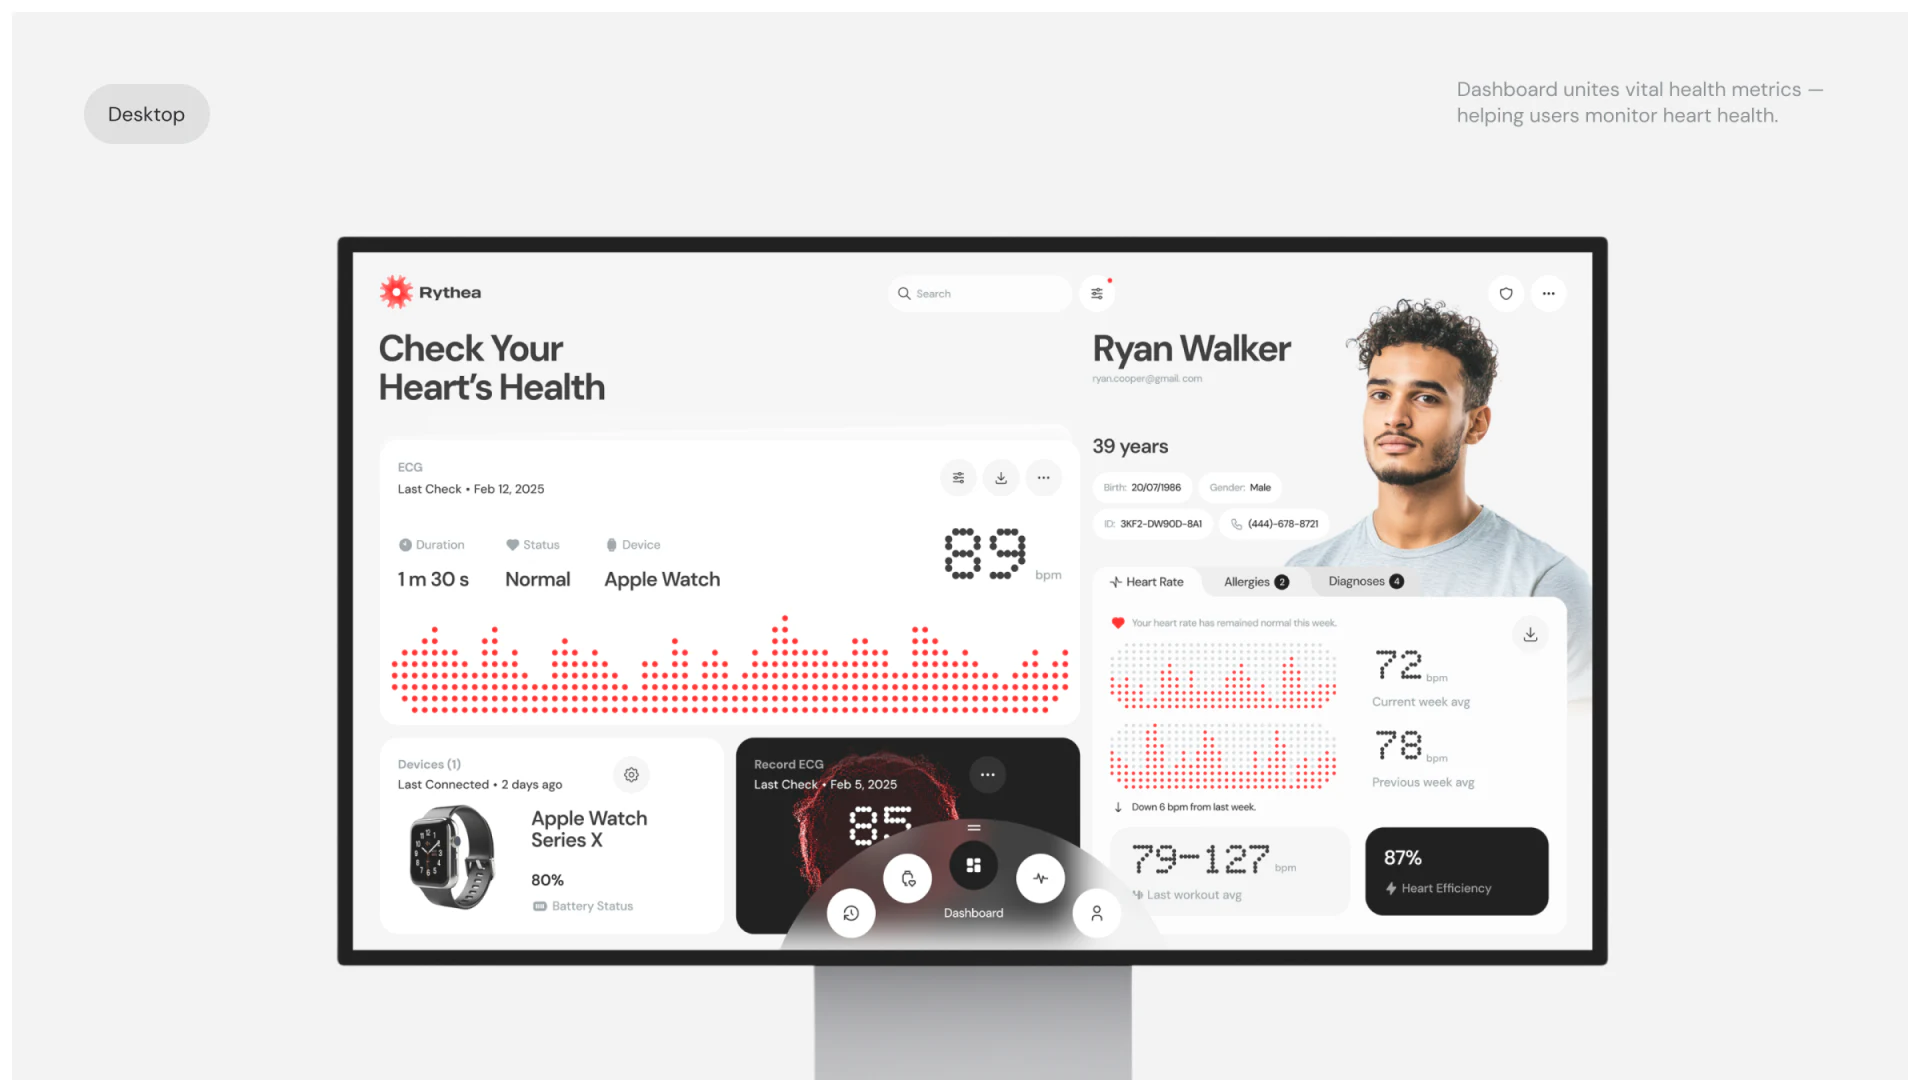
The main desktop card gives an ECG record substantial space, with date, duration, status, and device above and 89 bpm on the right. Information is not reduced to one large number: the reading has visual priority, while other fields identify the record.
On the right, 72 and 78 label this-week and previous-week averages, with recent exercise ranges below. A device card shows connection time and battery. Boundaries separate meanings and collection conditions from results. Name and profile at upper right identify whose records are shown.
Red dot patterns relate charts and numbers visually without giving them identical meanings. Graphics need time scales and explanations; summaries need reporting scope. Pictured status wording supports interface analysis only, not health judgments.
The measurement page makes the process central
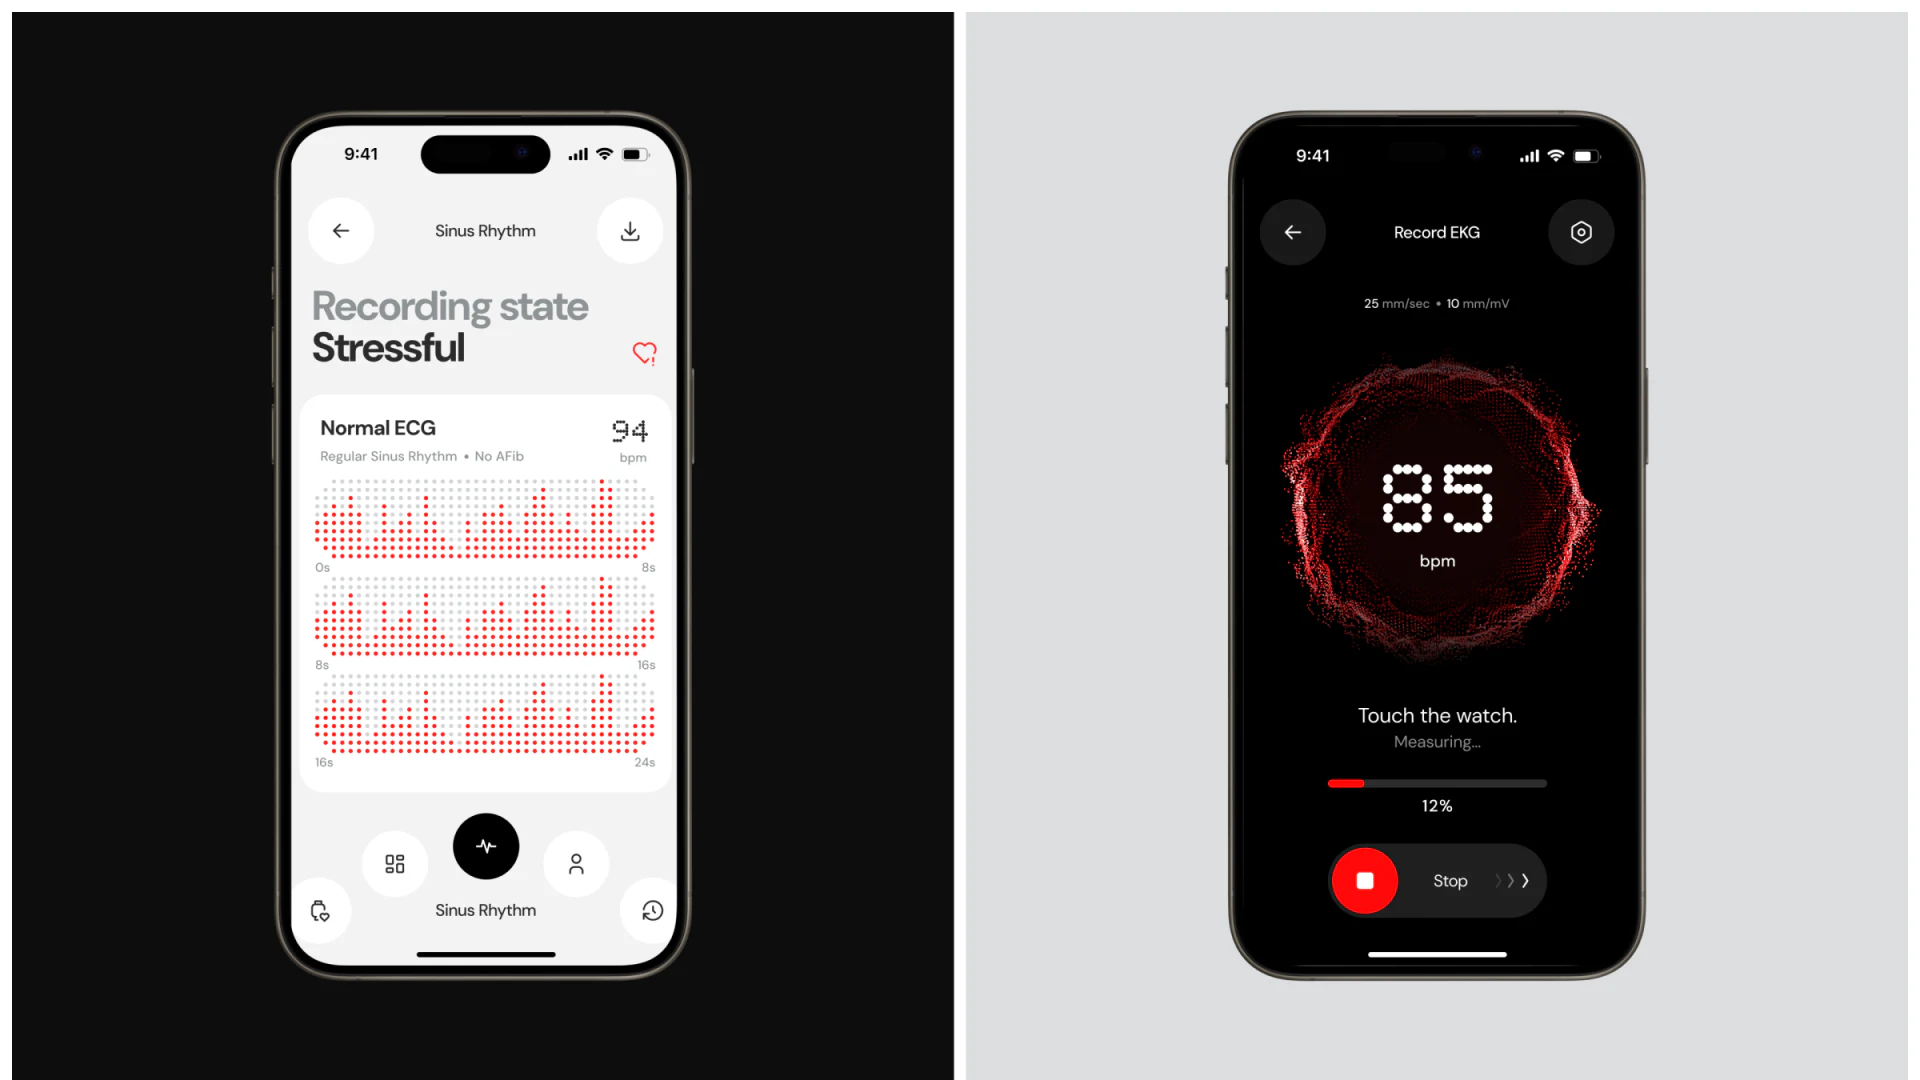
The black measurement view centers 85 bpm and a red ring, followed by Touch the watch, Measuring, percentage progress, and Stop. Weekly statistics are absent, placing the current action and interruption entry where attention falls.
The white record page uses a segmented timeline and download entry, visually separating collection from viewing. JVDS Design Studio finds this stage difference helpful, but titles should explicitly distinguish collecting, completed, and no usable record rather than relying on black and white.
Stop has text and icon for findability. Its consequence still needs explanation: partial-record retention, restarting, and device reconnection. Progress describes how far the process has gone; ending information describes what it left. Both should form measurement feedback.
Mobile cards continue the style and need semantic checking
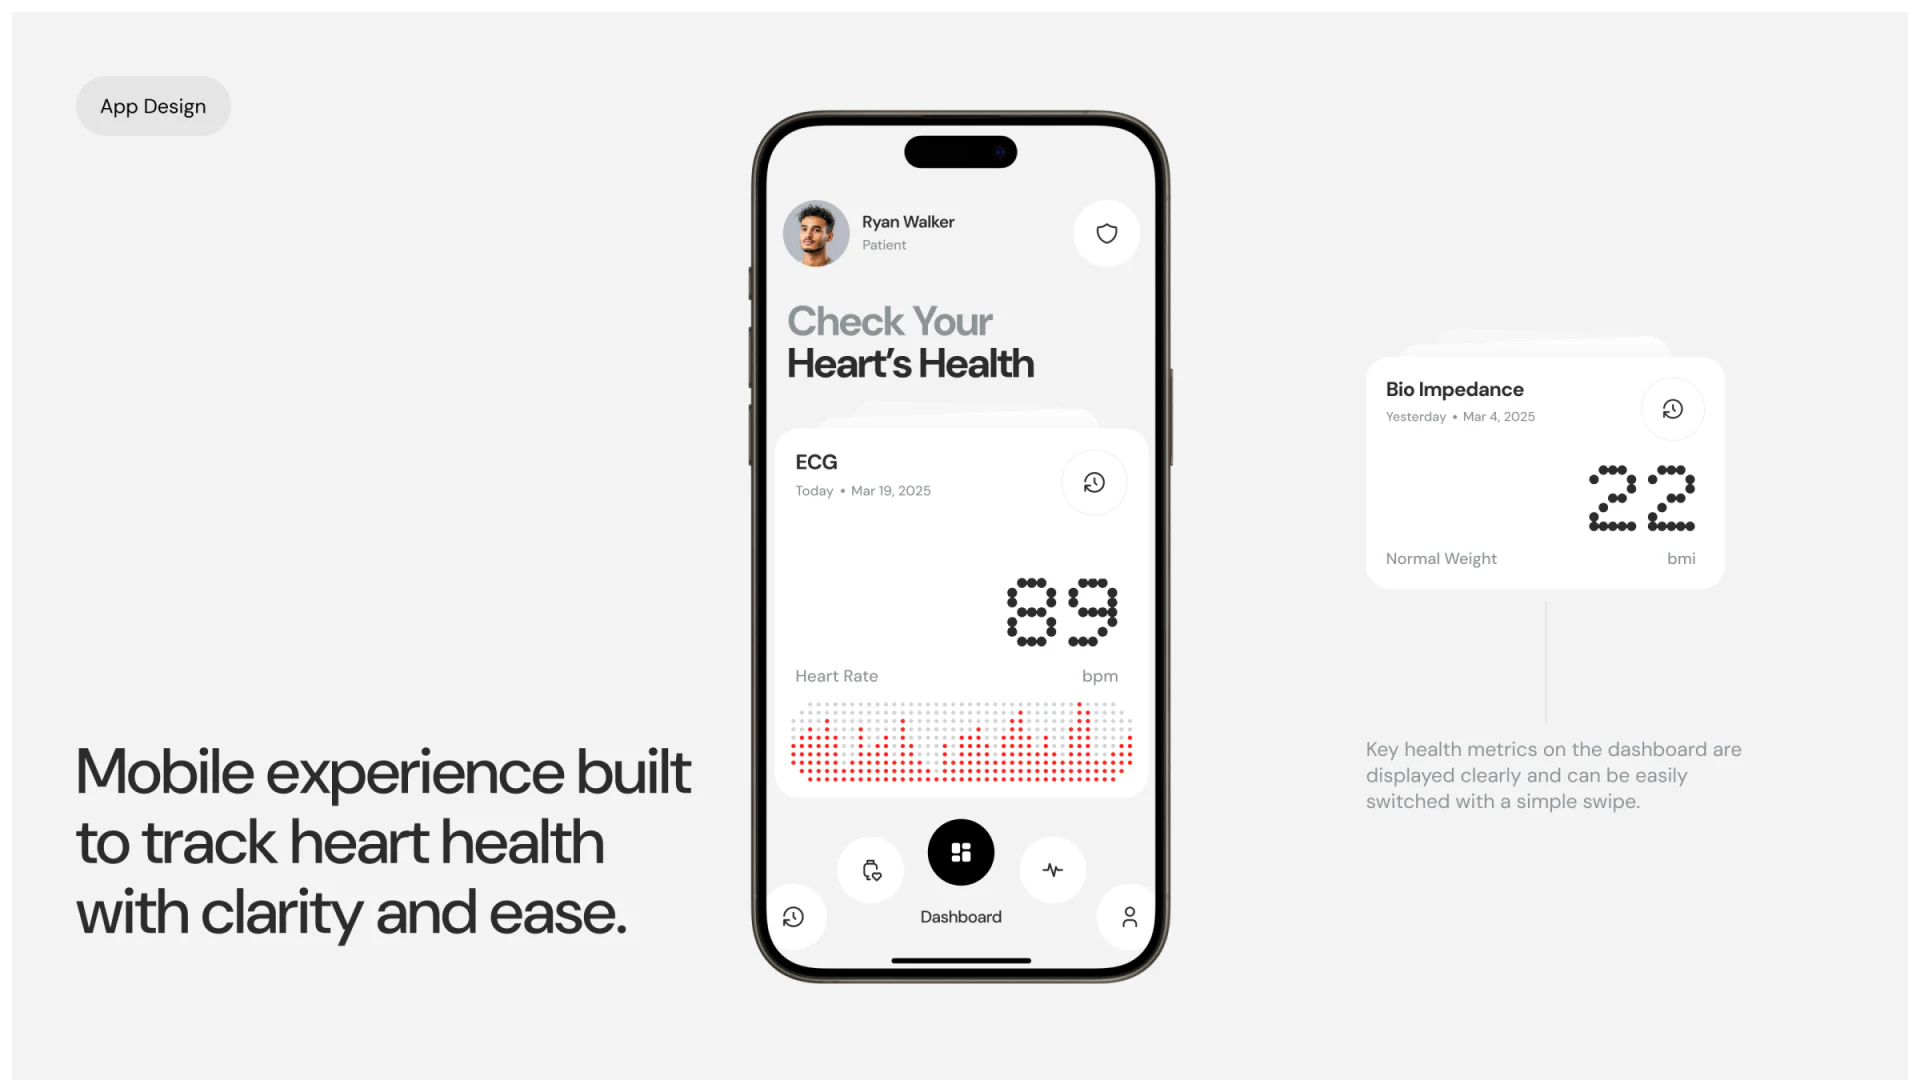
The mobile ECG card puts title and date above, reading and unit in the middle, and graphic below. Another outer metric card shares rounded corners and dot-matrix numbers. This stable structure supports similar reading without searching for title and date again.
Today corresponds to March 19, while Yesterday on another card corresponds to March 4. If these share one reference moment, relative and absolute dates need alignment; if captured at different dates, their combination should avoid misleading readers.
Bio Impedance on another card appears beside bmi and Normal Weight, requiring the metric-field relationship to be checked. The visual system already gives readings attention; extending that care to titles, units, sources, and dates would give attractive cards accurate content relationships.
Make records and states understandable together
Health-record and device-companion products can begin by separating single records, historical summaries, and collection processes, defining time and source for each.
JVDS Design Studio provides UI/UX design, website design, and development services for data cards, device states, and record viewing flows.
 Link copied