Introduction:
Recently, many people around me have begun working in data visualization because more businesses and government organizations want to use this form of presentation to demonstrate performance or capabilities. Many people have therefore asked me: What exactly is data visualization? What skills does it require? What does the work involve? Below, I will briefly share my perspective.

Alibaba Cloud DataV
Because data visualization currently takes both 2D and 3D forms (2D and 3D are used here as accessible terms for this article's analysis, not as universal industry classifications), there are already many articles and tutorials about 2D data online. I believe that material is relatively applicable across the industry, so today we will focus on 3D data visualization.
Current situation: 3D visualization remains a relatively specialized design field. Most clients are government or B2B organizations, and projects are often highly confidential with little public communication. This makes the field appear particularly mysterious and creates a relatively high barrier to entry. At the same time, demand from government and business is substantial. Smart-city development, military electronic sand tables, and intelligent transportation have created a broad range of projects, resulting in a shortage of designers with these capabilities.
What Is 3D Data Visualization?

The term generally refers to data visualization projects built with 3D game engines such as Unity3D. These projects can recreate the real-world setting behind the data more intuitively and connect to live data feeds. The result feels more dimensional and technology-driven while remaining flexible enough to support complex operations.
What Skills Does a 3D Data Visualization UI Designer Need?
In my view, although this role is still a form of UI design, it differs substantially from the conventional understanding of a UI designer. The display may range from a 16-by-9-meter screen to an iPad, so designers must understand how to work across very different screen sizes. 3D data visualization relies more heavily on spatial and modeling-based expression. Understanding three-dimensional form and changes in spatial interaction is therefore especially important. Below, I will break down the required capabilities.
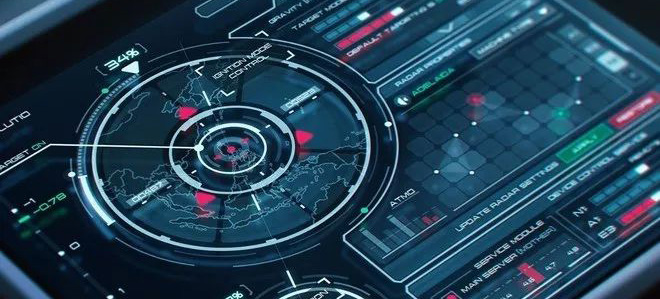
FUI style
Visual Design Skills:
Visual design is a foundational capability. In data visualization, it covers the visual treatment of scenes and objects, the appearance of data charts, and the visual representation of maps, buildings, and data. The style is usually technology-oriented, placing greater demands on designers' imagination and ability to represent technology products. FUI is therefore highly valued, and watching more science-fiction films can also help designers develop this ability.
Data Visualization Skills:
First, you need a strong ability to express data—that is, to translate the data phenomena users want to see into a designed visual form. You must also understand what each data point and relationship truly means before designing, which requires a deeper understanding of charts. Because the result is implemented in 3D, you must also understand how the chart differs between 2D and 3D. If you choose 3D, how will the chart distinguish itself meaningfully from a 2D chart? This question deserves careful consideration.
Three-Dimensional Interaction Skills:
Interaction in three-dimensional software differs from interaction in two dimensions. Although mobile design also introduces the concept of a Z-axis, it is not the same as the interaction required in current visualization projects.
Modeling Skills:
In practical work, many buildings cannot be represented in a design draft through spatial imagination alone. We therefore often use 3D modeling software such as Cinema 4D. This helps us produce design drafts quickly while representing objects accurately.
What Does a 3D Data Visualization UI Designer Deliver, and How Is It Implemented?
For UI designers entering data visualization, one of the biggest concerns is how a project is implemented. Every company has different requirements. The following is simply our own approach, shared as a practical example.
We generally deliver several items: static design frames, including annotations and exported assets; a video demo; and, depending on the project, an interaction flow.
Basic Process:
This step is essential. The project team first uses our static design frames to align with stakeholders and confirm that the intended effect matches the proposed design. If the two sides interpret the concept differently, the design is revised according to the requirements. After the revisions are complete, the static frames are handed to the modeler, who creates the 3D models based on them. Designers do not necessarily need to build the models themselves, although modeling knowledge is helpful because it enables the modeler to work more quickly. Project requirements vary, and designers like us often work under tight timelines. We need to produce visuals quickly so the proposed direction can be confirmed with stakeholders.
Static Design Frames:
Their primary purpose is to support communication with stakeholders and confirm the intended effect with the modeler. During final acceptance, the output is also evaluated against these static frames.
Annotations:
Font family, font size, color, position, and basic data parameters. The annotation approach is largely consistent with the familiar UI design process.
Exported Assets:
Icons and images that developers cannot reproduce through code.
Video Demo:
Whether a video demo is produced depends on the project's difficulty. Larger projects usually allow time for a demo, which gives stakeholders and developers a clear presentation and helps make the development direction more explicit.
Interaction Flow:
We also need to consider what the complete designed experience will look like and how interactions will respond after a click. Once the basic direction is confirmed, the static frames and interaction plan
Need design or website development services?
JVDS Design Studio is a professional design studio focused on digital product experiences and brand identity. We work with businesses in China and overseas that want to strengthen their brand image, improve user experience and grow their business, providing clear, usable UI/UX design, high-quality website design and development, app and mini-program development, and cohesive, distinctive brand identity design.
Working on a B2B system or an app? Share your current screens and key user tasks so we can discuss the design scope.
 Link copied