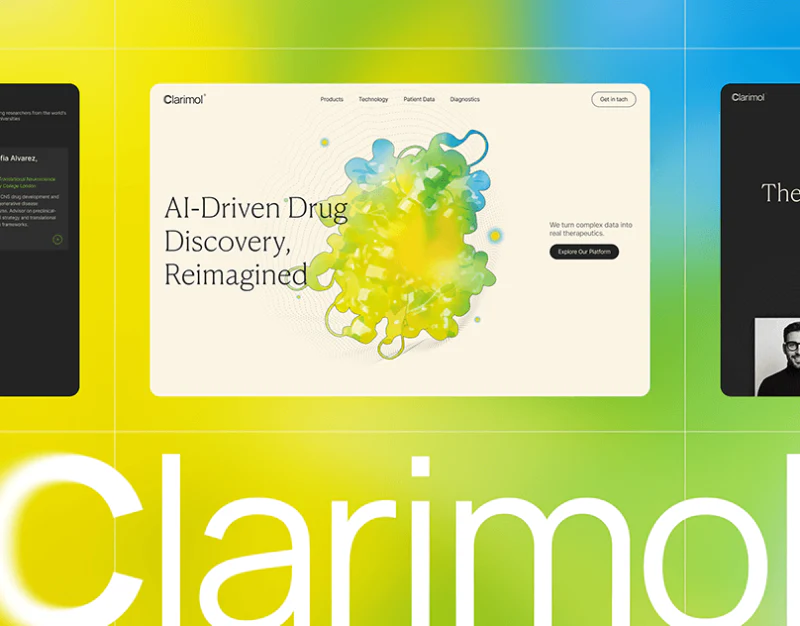
Clarimol presents a research platform with a cream background, serif headings, and colored molecular forms. Research platform website design can establish thematic recognition visually while giving stages, mechanisms, and charts different reading rules, helping visitors distinguish a broad introduction from checking specific material.
Forms and type establish a research identity
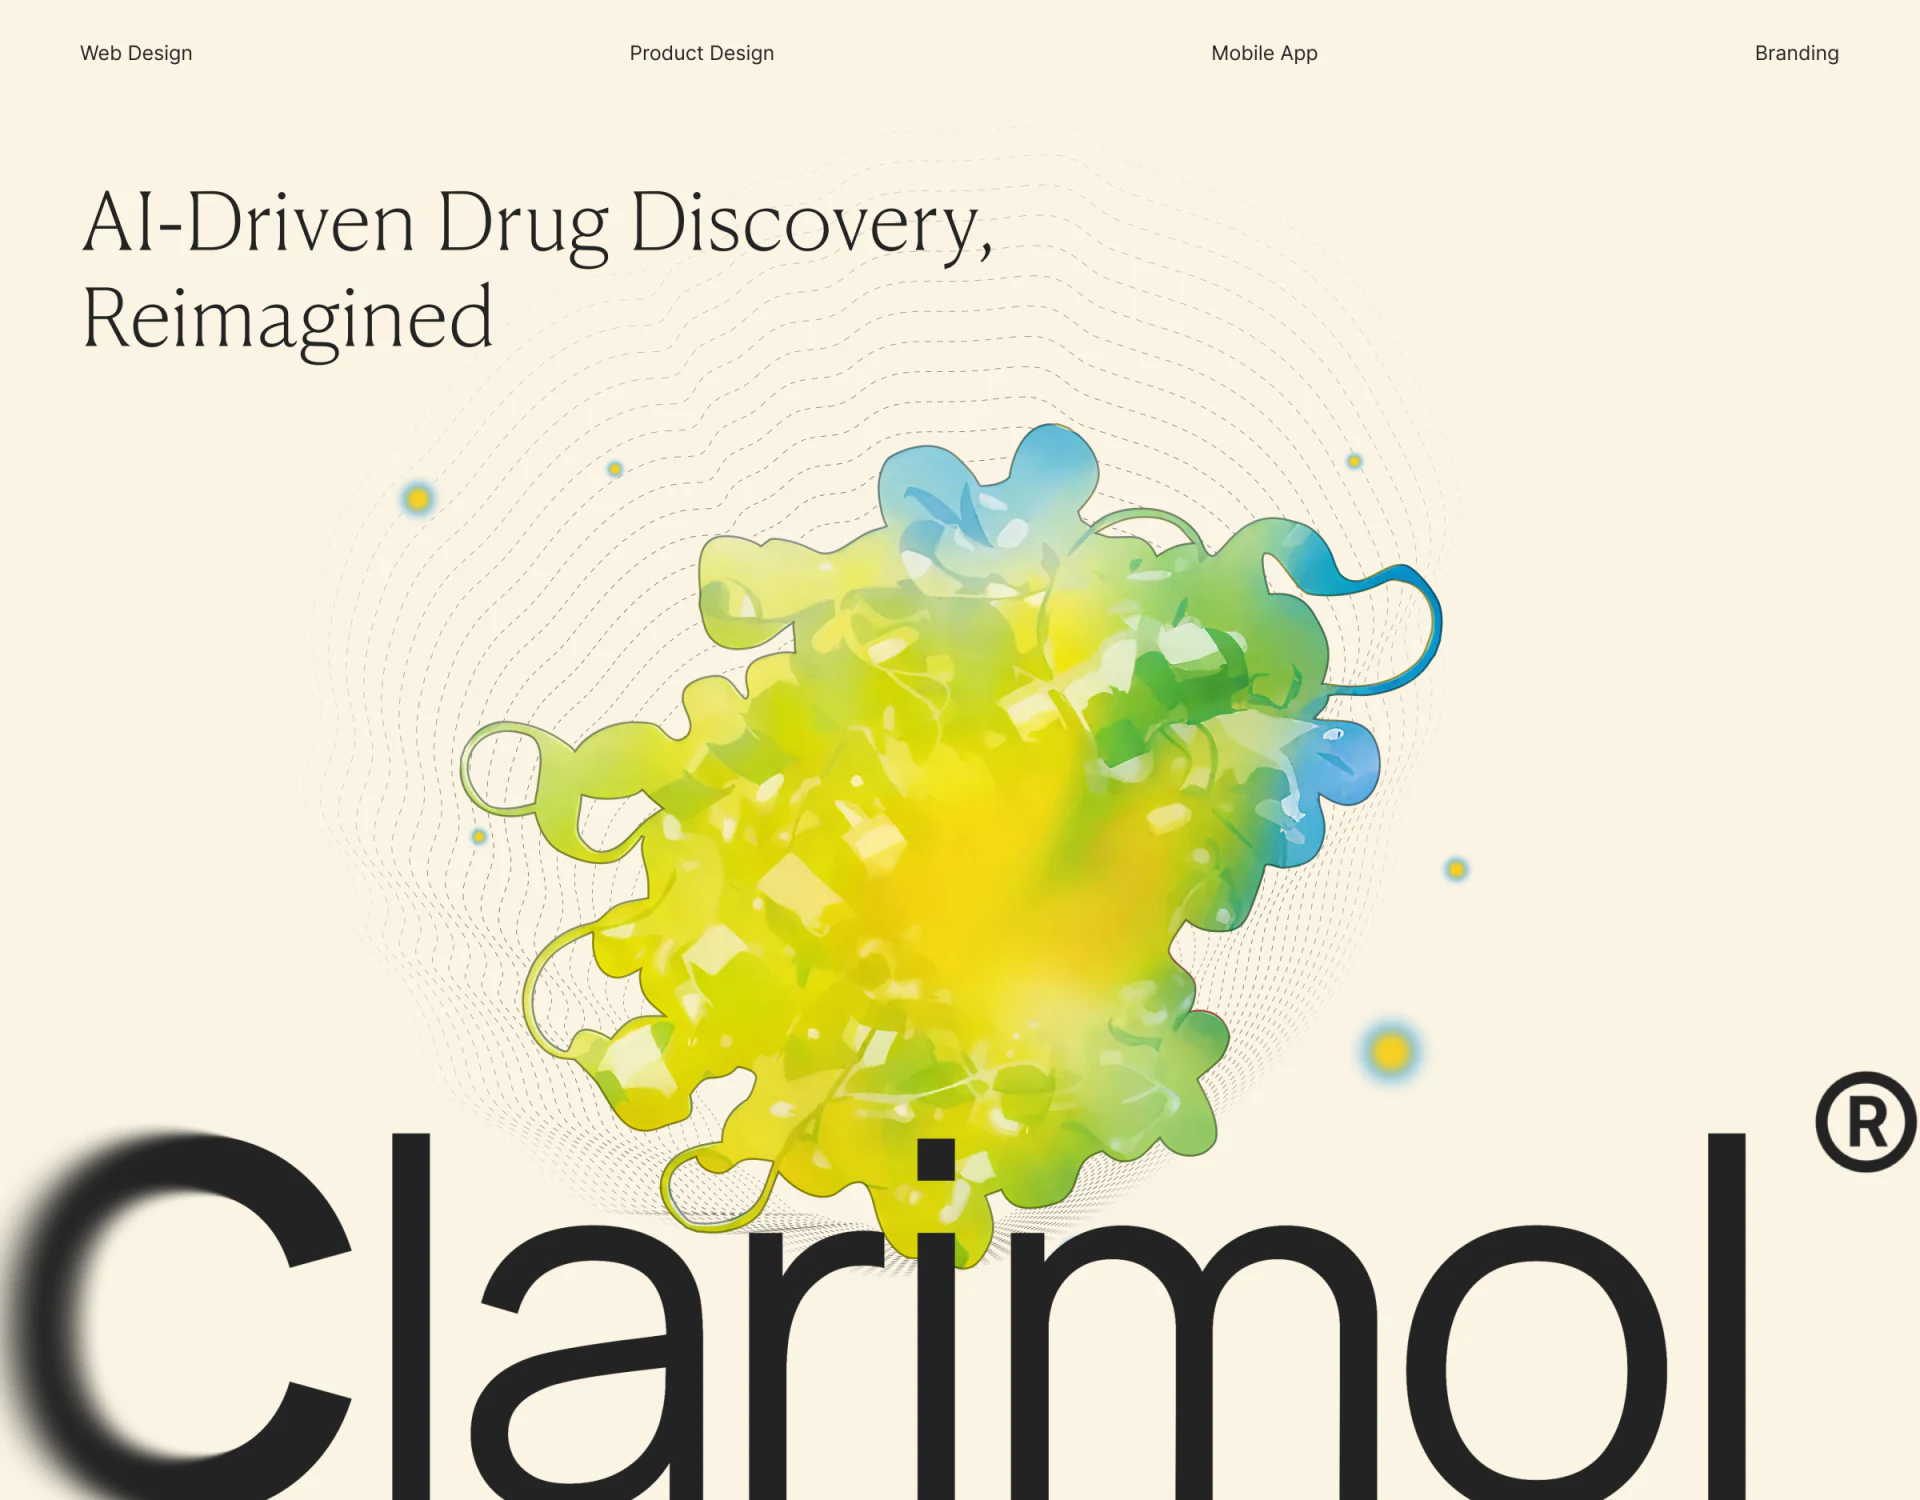
An irregular yellow, green, and blue molecular form occupies the center, with fine outlines spreading outward and large Clarimol lettering below. Light serif headings contrast with bright translucent graphics. The pale background gives outlines space and makes the research theme recognizable without turning the page into a dense console.
Such graphics suit brand imagery, while technical explanations still need to identify inputs, processing, and outputs. A real structure should have its name and identity stated; an illustration should remain distinct from specialist material. Letting graphics identify and words explain is clearer than expecting complex forms alone to communicate capability.
A stage overview locates deeper reading
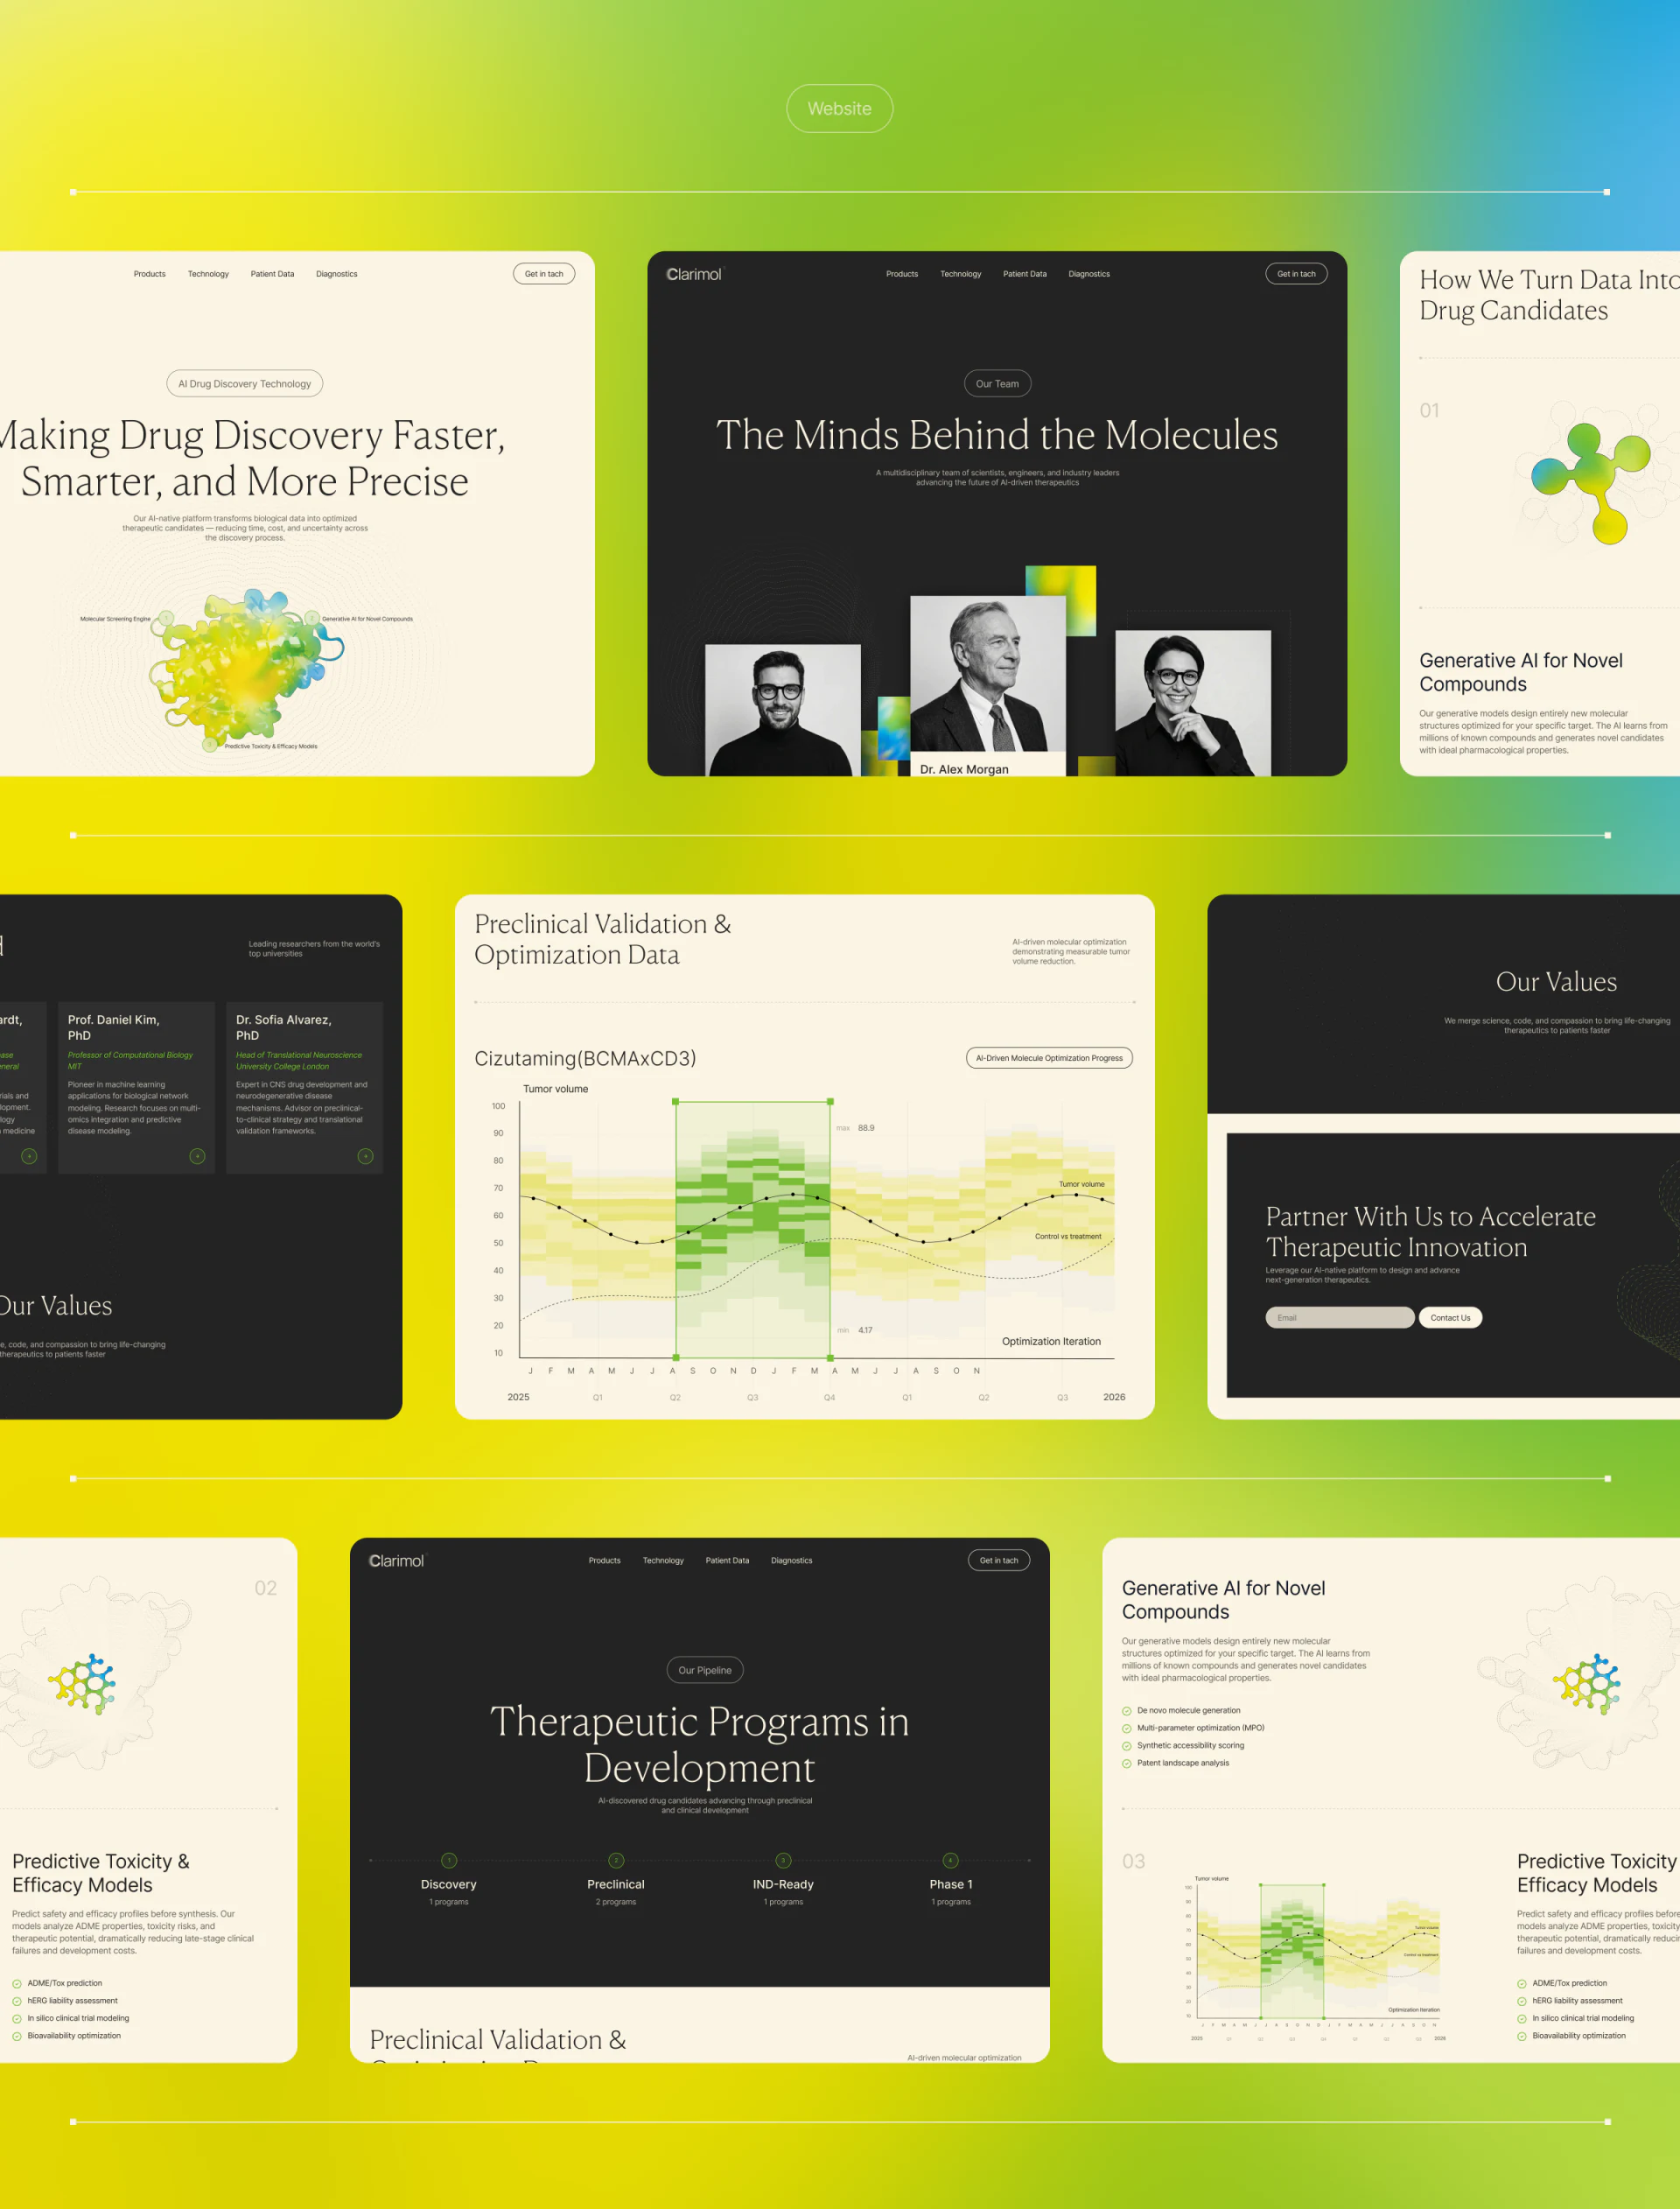
The page collage places team, mechanisms, development stages, data, and collaboration in one visual system, alternating black and cream. Discovery, Preclinical, IND-Ready, and Phase 1 run along a line with project counts; mechanisms use separate numbers, graphics, and short entries. Stages and mechanisms therefore have distinct entries.
Stage names help visitors locate relevant projects, while counts are summaries rather than substitutes for details. JVDS prefers nodes leading to identified projects with record dates so readers can explore scope. Team names, professional roles, and mechanisms carry different responsibilities without all needing to fit into an overview card.
Email and contact actions follow the content in the collaboration area. Explaining discussion topics or available materials would let visitors continue with a specific subject, making the connection from introduction to professional exchange more natural.
Layered charts first need defined axes and series
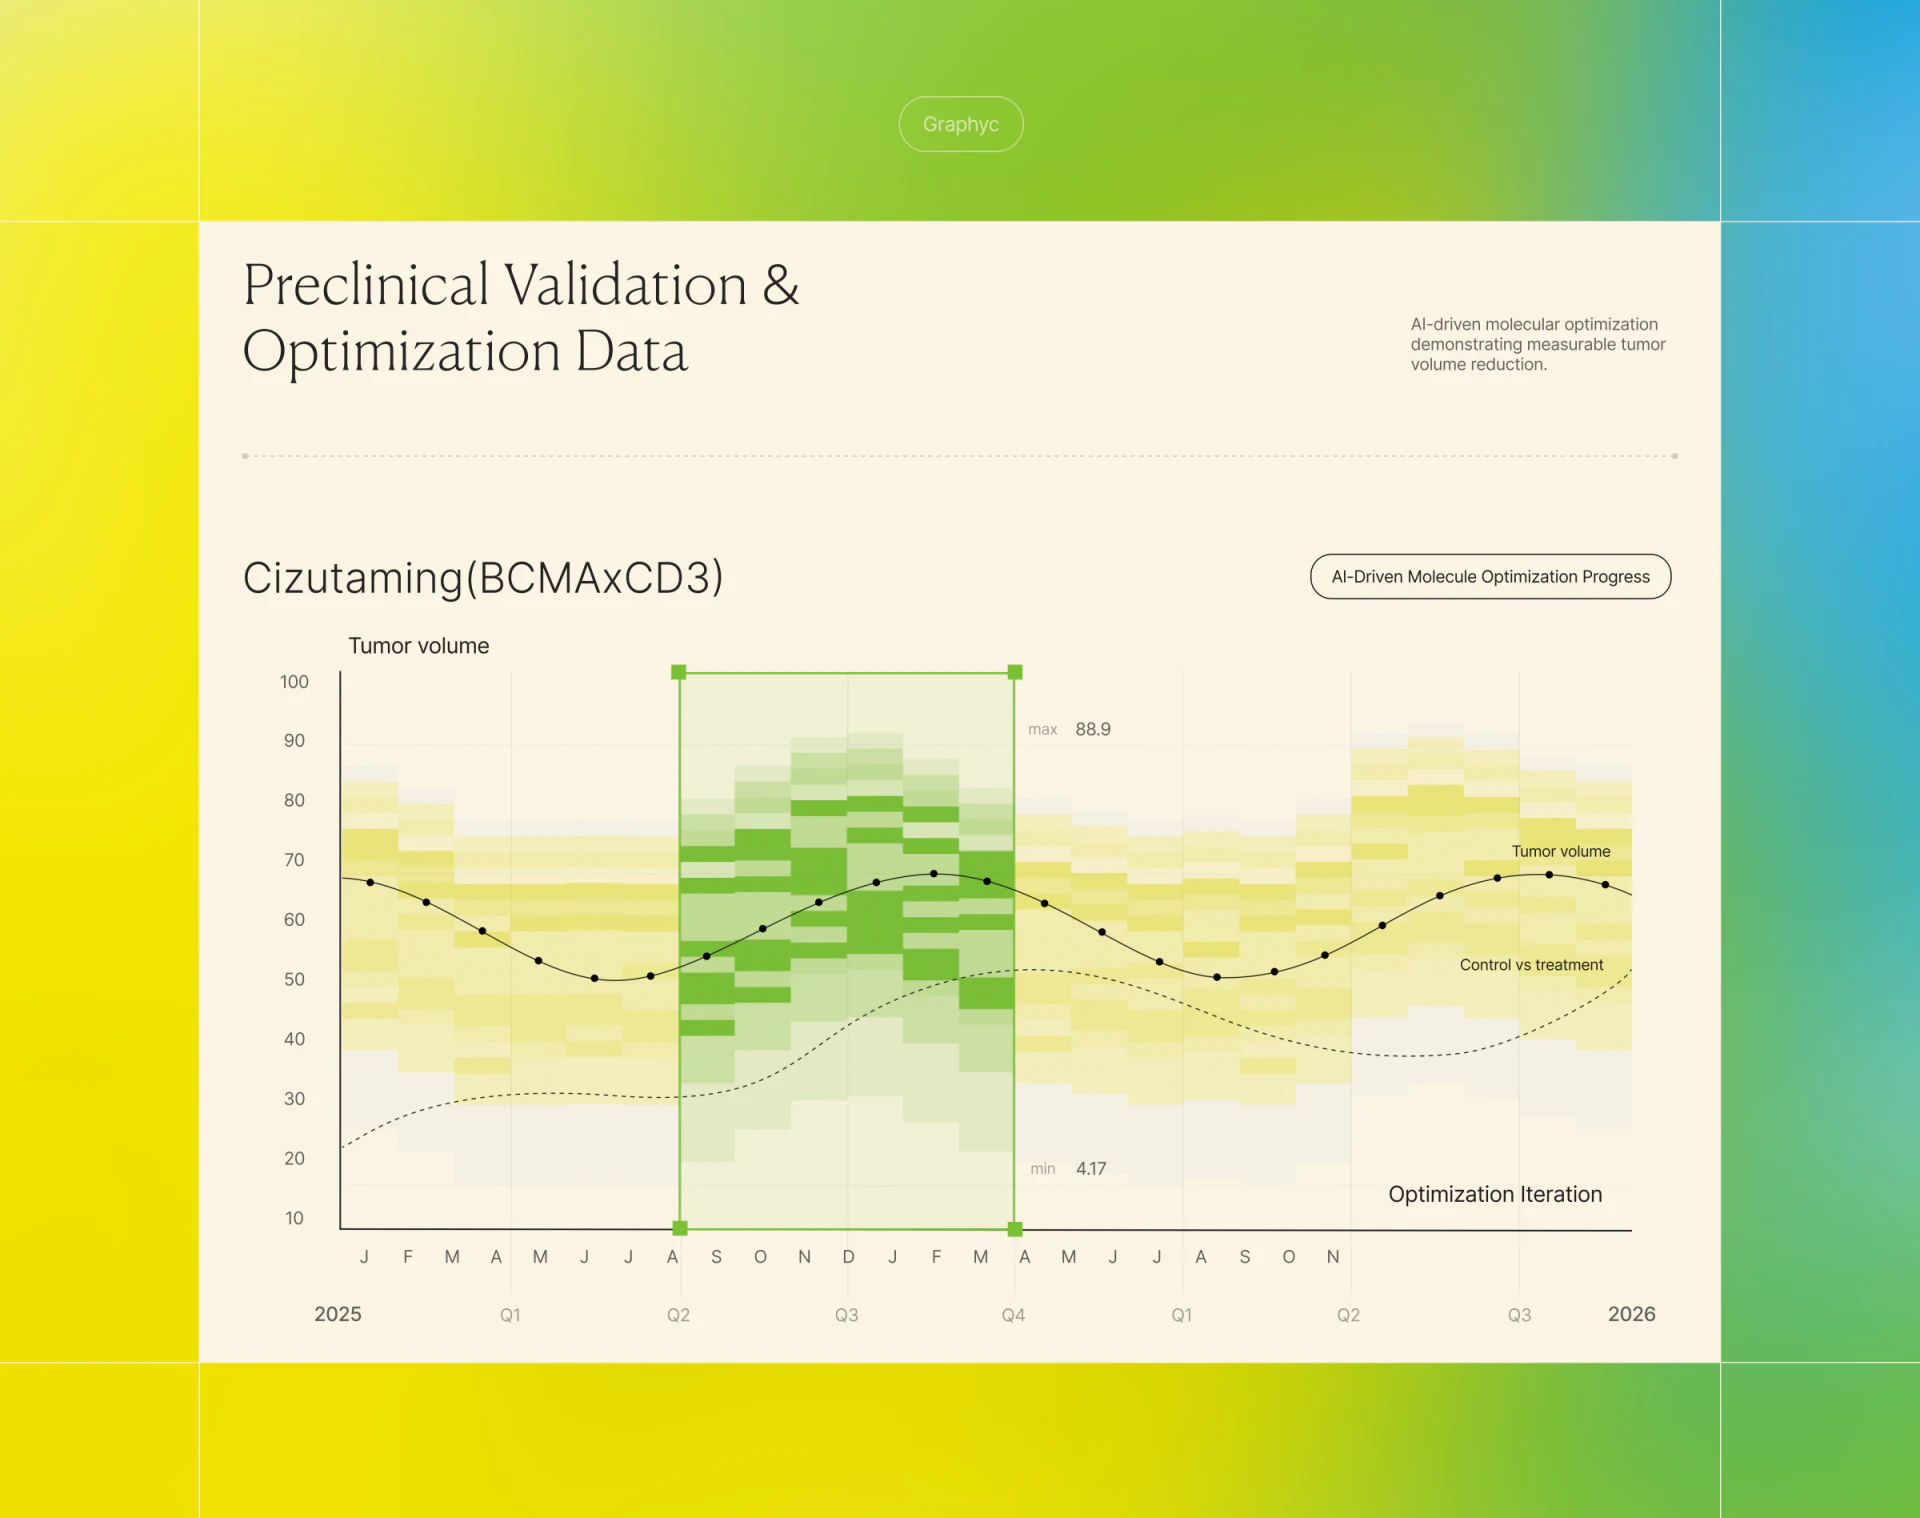
Black solid lines and points, dashed lines, yellow-green areas, and a green rectangular selection overlap in the chart. Line styles separate information visually. The selection also has boundary endpoints and maximum/minimum values, making it a region requiring explanation rather than mere background color.
The vertical axis says Tumor volume without a unit. Months, quarters, years, and Optimization Iteration coexist horizontally, leaving it unclear whether distance means time or iteration. Define axes first, then explain series, areas, and selections. Month-to-quarter correspondence should also stay consistent so readers can restate the scale.
With many layers, show the core series first and offer clearly named toggles and value inspection. Professional chart quality comes from accurate reading, not richness alone. The useful division here gives brand, stages, and specialist content separate spaces; complete chart definitions would make the whole site more suitable for deeper reading.
Organize research introductions into checkable materials
If your research or technical platform presents directions, project stages, and charts, separate material identities and reading depths before designing details and collaboration entries.
JVDS Design Studio provides UI/UX design, website design, and development services for research platforms, technical explanations, and material presentation pages.
 Link copied